Bitcoin's growth trajectory after the halving
Tracking Bitcoin's price relative to the growth trajectory of each halving cycle.
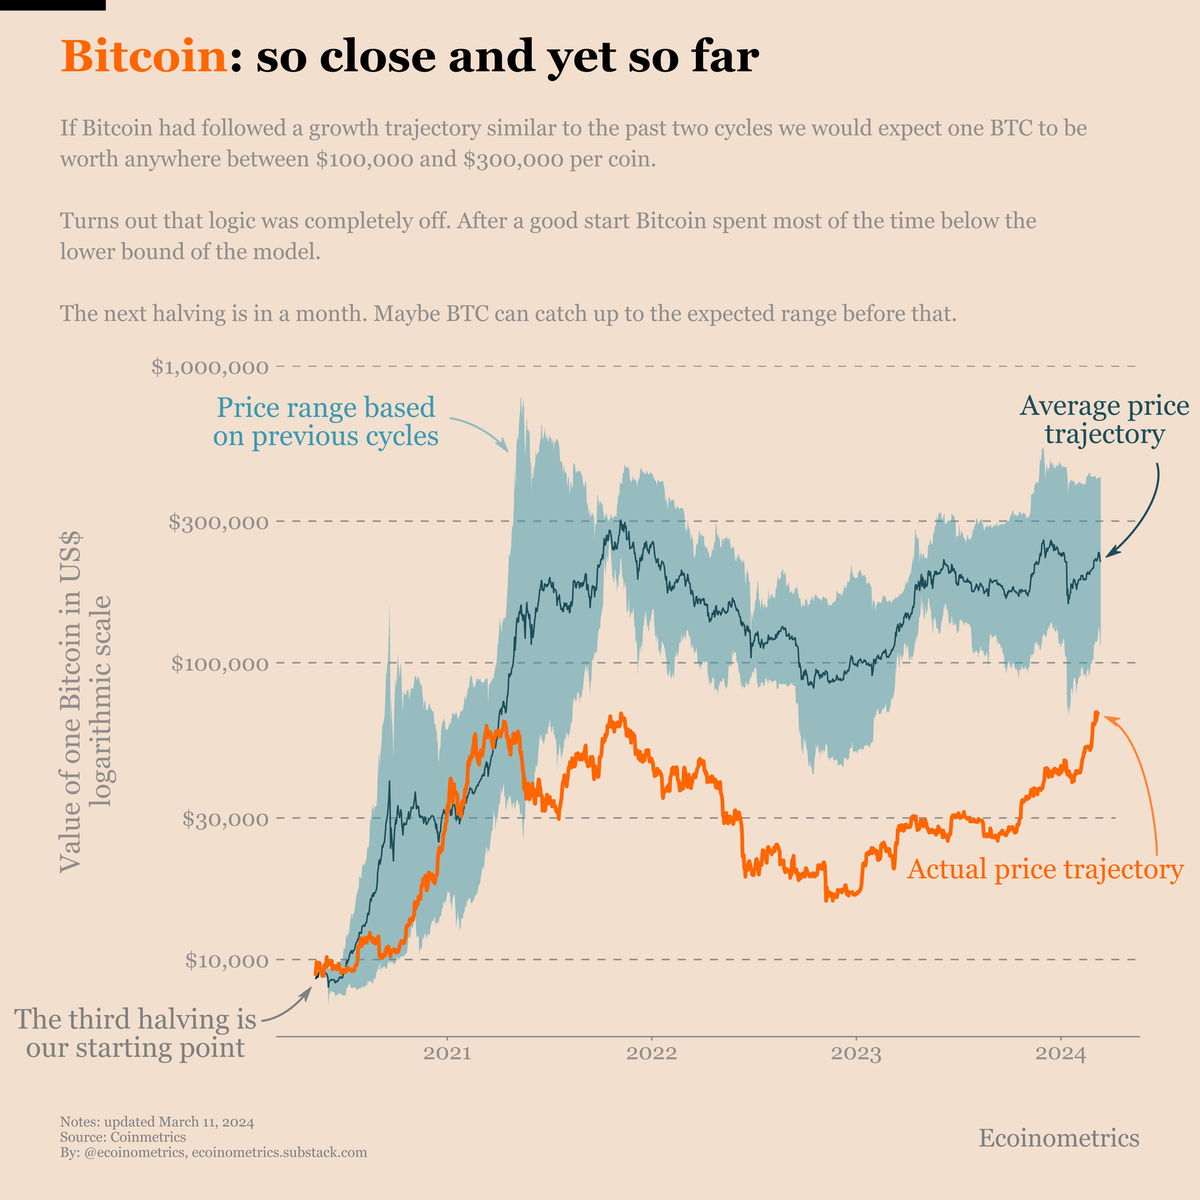
Bitcoin's history doesn't repeat, but it often rhymes.
Assume Bitcoin follows similar growth trajectory after the fourth halving. What would Bitcoin's price trajectory looks like?
That's what you see on the chart below.
The light blue area is the price range you get from applying the growth of the previous halving cycles to Bitcoin's price on the day of the 4th halving.
The dark blue line is the average growth trajectory (specifically the geometric average as it makes more sense for exponential growth).
We are now on the zero day of the fourth halving cycle. Let's see where this is going.
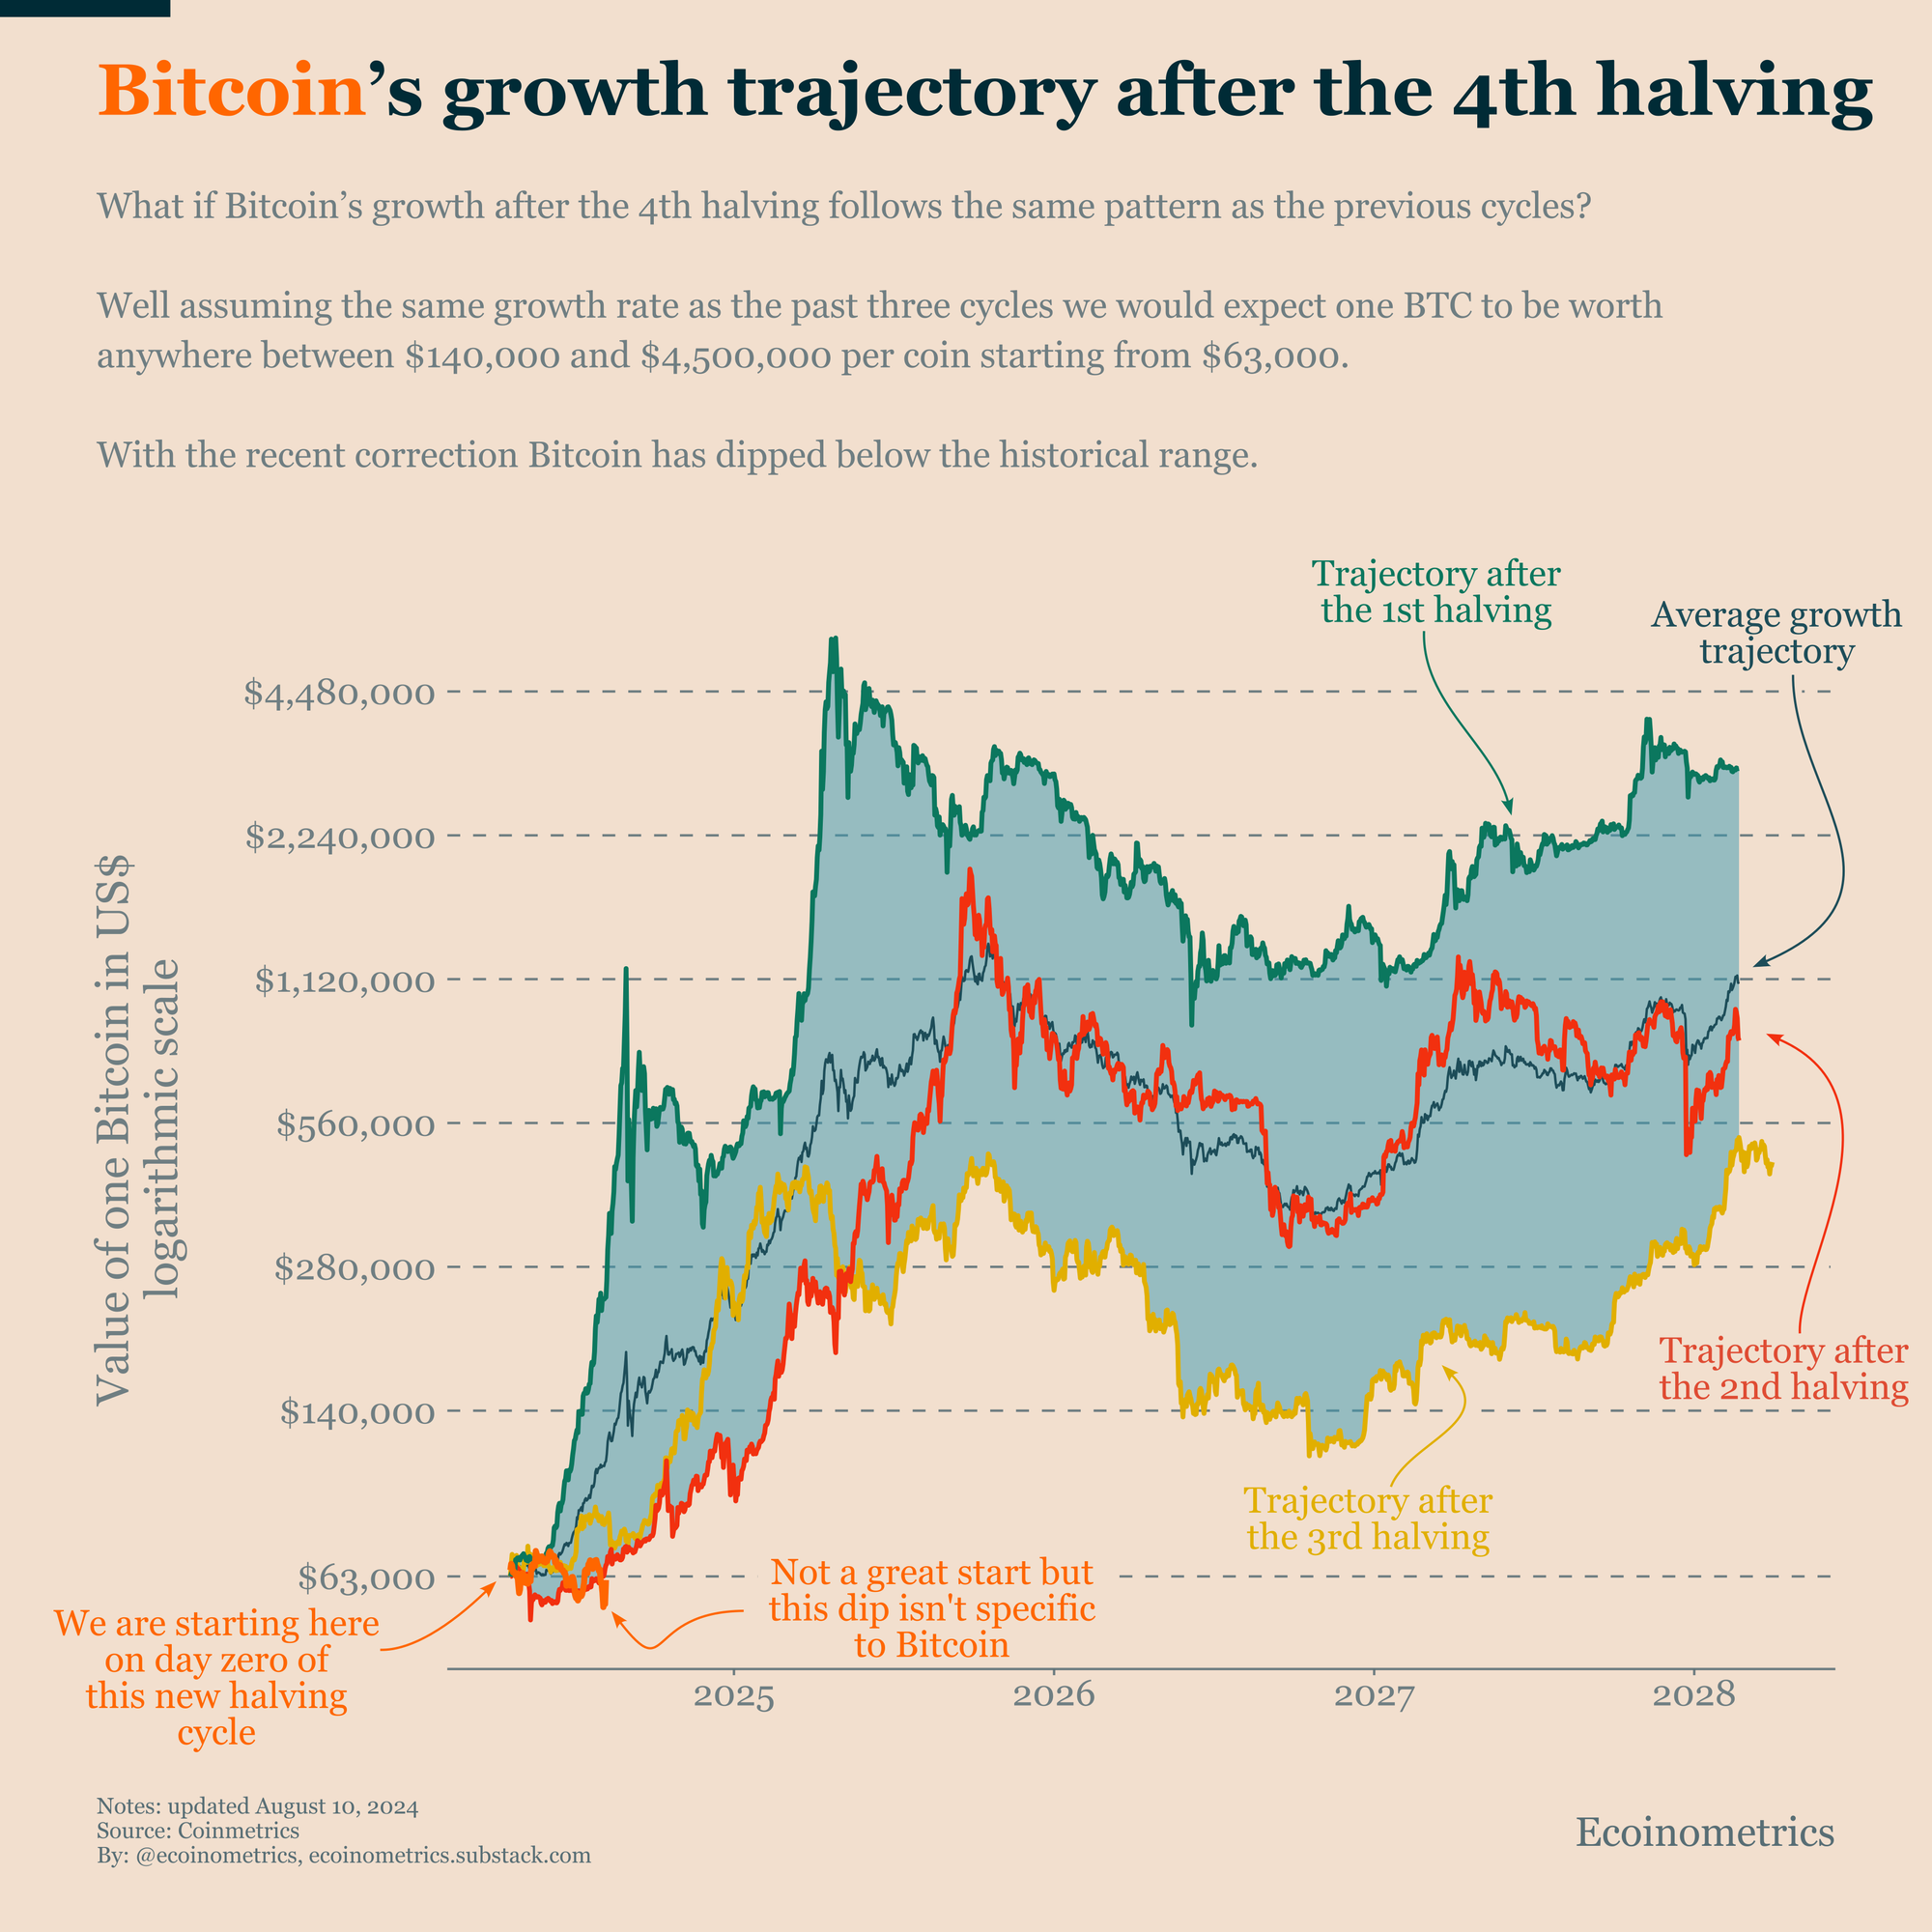
Bookmark this page. Chart updated daily.
P.S. We spend our days, countless hours really, doing research, exploring data, surveying emerging trends, looking at charts and making infographics.
Our objective? Deliver to you the most important insights in macroeconomics, Bitcoin and digital assets.
Armed with those insights you can make better investment decisions.
Are you a serious investor? Do you want to get the big picture to get on the big trades? Then click on the button below and subscribe to the Ecoinometrics newsletter ✉️ ⤵️
Cheers,
Nick