Stabilizing Financial Conditions Could Support Bitcoin
Financial conditions might have just stopped tightening. After weeks of deterioration, the NFCI is starting to stabilize, driven by improving credit conditions and a pause in de-risking.
The pressure on Bitcoin is starting to lift
After weeks of tightening, financial conditions look like they have just stopped getting worse.
The inflection
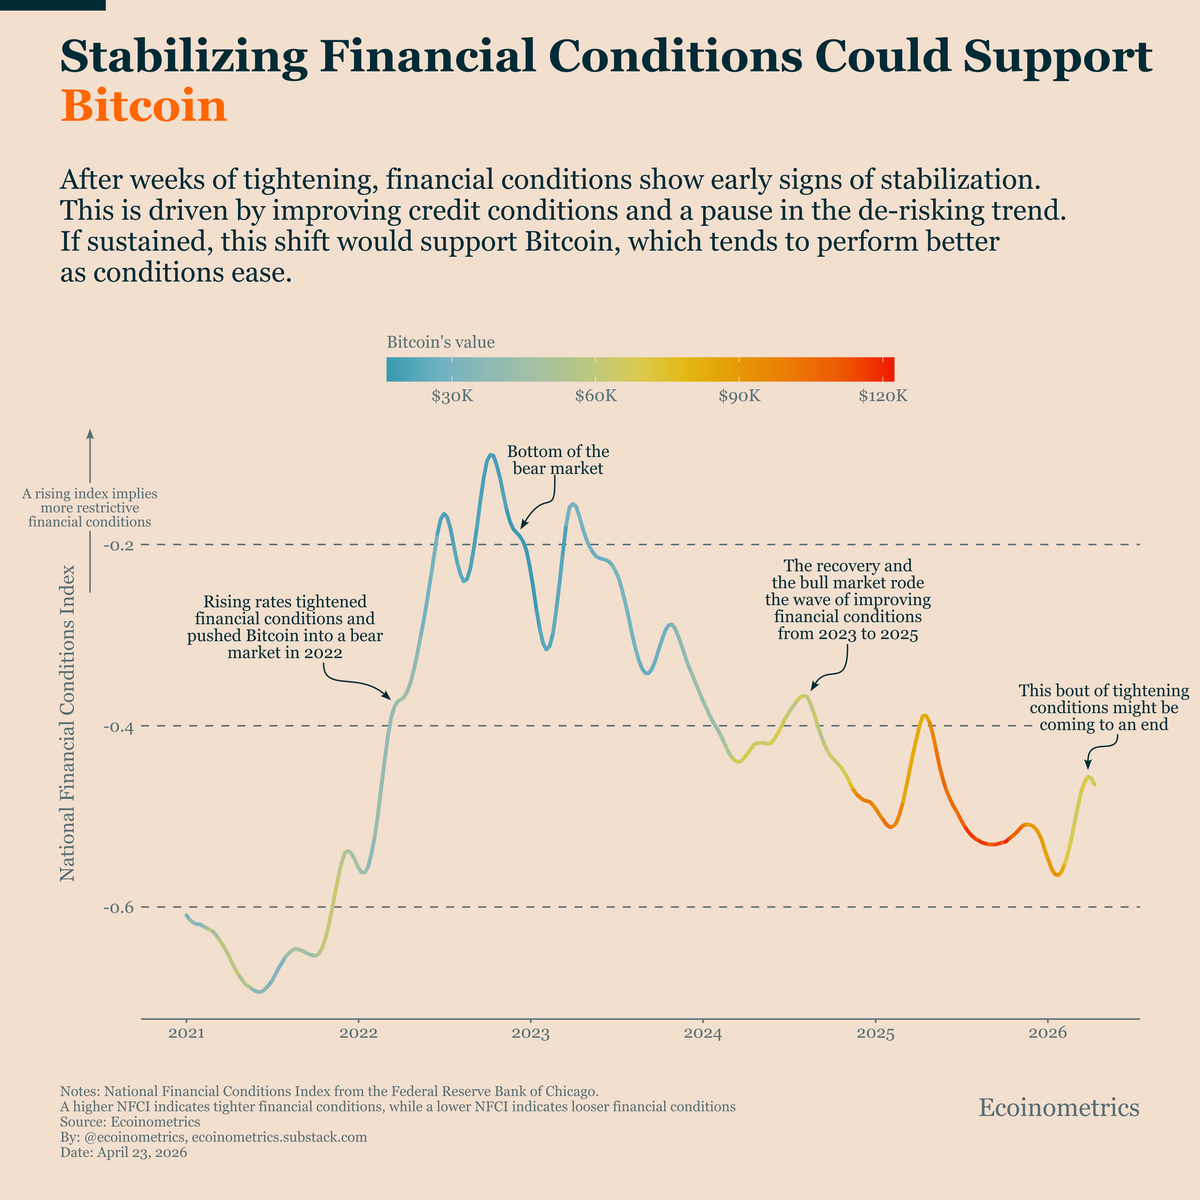
The National Financial Conditions Index (the Chicago Fed's weekly read on credit, leverage, and risk) had been climbing for weeks. Rising means tightening. Now it has flattened.
Look at the rightmost edge of the chart above: the line had been bending up (tightening) and has just started to bend back down. The drivers, per the Chicago Fed's decomposition, are improving credit conditions and a pause in the de-risking trend.
Hover or tap the chart to read any past week.
Why this matters for Bitcoin
Bitcoin is a long-duration risk asset. The historical record is unsubtle:
The headwind that just lifted is the same kind of headwind that drove Bitcoin into the 2022 bear market.
You can see it in the colors of the chart: the cool blue stretch, when Bitcoin's price collapsed, sits squarely on the part of the line that was bending up into tighter conditions. The red and orange of the recent highs followed from the part that bent down through 2023–2025.
But this only works if it continues
Stabilization is not easing. To get a tailwind, the NFCI has to keep falling. Here is the thing to test against your priors:
Imagine that 12 weeks from now, the NFCI sits at −0.55. That is — from where it is today, a path of —.
In past 12-week windows where the NFCI moved by a similar amount, Bitcoin's median return was — (across — historical analogues since 2014).
The dashed orange line is your scenario. The shaded band is the interquartile NFCI path of matching historical episodes.
The bottom line
Loading…
Markets are clearly shrugging off macro risks right now. But the only thing that turns this from a paused headwind into a durable tailwind is more weeks like the last one. If tightening resumes, the window closes quickly.