How To Invest with Dollar Cost Averaging?

Dollar cost averaging is the idea of buying stocks or other assets at regular intervals to build a position. It is one of the most powerful and simple investment strategy for individual investors. Dollar cost averaging (or DCA) allows you to:
- Build a position over time even if you don't have a large sum of money to invest.
- Avoid having to worry about market timing and market volatility.
- Automate everything and focus on long term goals.
In this post we'll dig into the data to see how dollar cost averaging works on actual examples in the stock market and in crypto. But first let's cover the basics.
Subscribe to the Ecoinometrics newsletter if you want to navigate the landscape of digital assets and macroeconomics with investment strategies backed by data.
What is dollar cost averaging?
There are two components to dollar cost averaging an asset:
- You need to buy a fixed amount of US dollar worth of that asset.
- You need to do so at fixed time intervals.
Whether you decide to target dollar cost averaging index funds, Bitcoin or some mutual funds the process is always the same. There isn't room for judgement calls with DCA, you just need to stick to the schedule, this is a prime example of disciplined investment strategy.
Dollar cost averaging is the opposite of market timing or lump sum investing. Instead of trying to guess the best time to buy you simply make purchases at regular intervals regardless of the price. Instead of deploying all your money in one go you spread it out in fixed amounts over a long period of time.
Here is an example of dollar cost averaging plan: on the first Monday of every month you buy $500 worth of shares of the SP500. In that case your fixed amount is $500 and monthly is your fixed time interval.
The concept is simple. The execution is simple. And you can even set it up as an automatic trading plan with most brokerage services.
No need to think about stock prices on that day or second guess yourself or worry that you are buying stocks at the peak of the market. You just do it and trust the process over the long term.
But what is that process exactly? Let's see how dollar cost averaging works.
How does dollar cost averaging work?
What does it mean to dollar cost average a stock? As per the rules you are always deploying the same amount of capital every time you buy. But every time you buy the stock price is different.
When the stock price is high, your dollar amount is giving you less shares. When the stock price drops, your dollar amount is giving you more shares. What you get over time with this investment strategy is an average purchase price for your dollar cost.
Say you are dollar cost averaging Amazon on a monthly basis for a fixed amount of $500. You are making the following transactions:
- May AMZN trades at $100 per share. Your fixed dollar amount buys you 5 shares.
- June AMZN trades at $125 per share. Your fixed dollar amount buys you 4 shares. Higher price, fewer shares.
- July AMZN traders at $83 per share. Your fixed dollar amount buys you 6 shares. Lower price, more shares.
At that point you have deployed a total of $1500 and you own 15 shares of Amazon for an average purchase price of $103 (Note that I'm rounding those numbers for ease of reading).
The stock's average price is what you use to evaluate your returns. Say the stock market does well and AMZN climbs to $135 per share then:
- Your return is +31%. That's the return from $103 to $135.
- The total value of your position is $2,025. That's 15 shares at $135 a piece.
- Your net profit of $525. That's the difference between the $1,500 you put in and the $2,025 it is worth now.
Of course those share price numbers are made up. But you get a sense of how it works.
We don't have to make up share price numbers though. We can just look at some historical data to see how the dollar cost averaging strategy performs on real investments.
So let's take a look at a few examples.
Example of dollar cost averaging the SP500
The SP500 is the stock market index tracking the 500 largest publicly traded companies in the US.
When it comes to steady performance over a long time horizon the SP500 is pretty much the gold standard. With something like a 6% annualized rate of return over the past 80 years you can't really go wrong when betting on the SP500.
Sure there are periods of ups and downs for the stock market but if you stick with it long enough the numbers go up and to the right.
So it isn't surprising that it is one of the most popular asset used for dollar cost averaging.
But how well has this strategy performed over time?
To answer that question we need to make our investment strategy specific:
- We invest a fixed amount of $500.
- We do that on the first day of each month open for trading.
Say you started applying this strategy in 2012. We want to know three things:
- How much money have you deployed in total?
- How much percentage returns have you made on this strategy?
- How much dollar returns have you made on this strategy?
After crunching the numbers here is what you find.
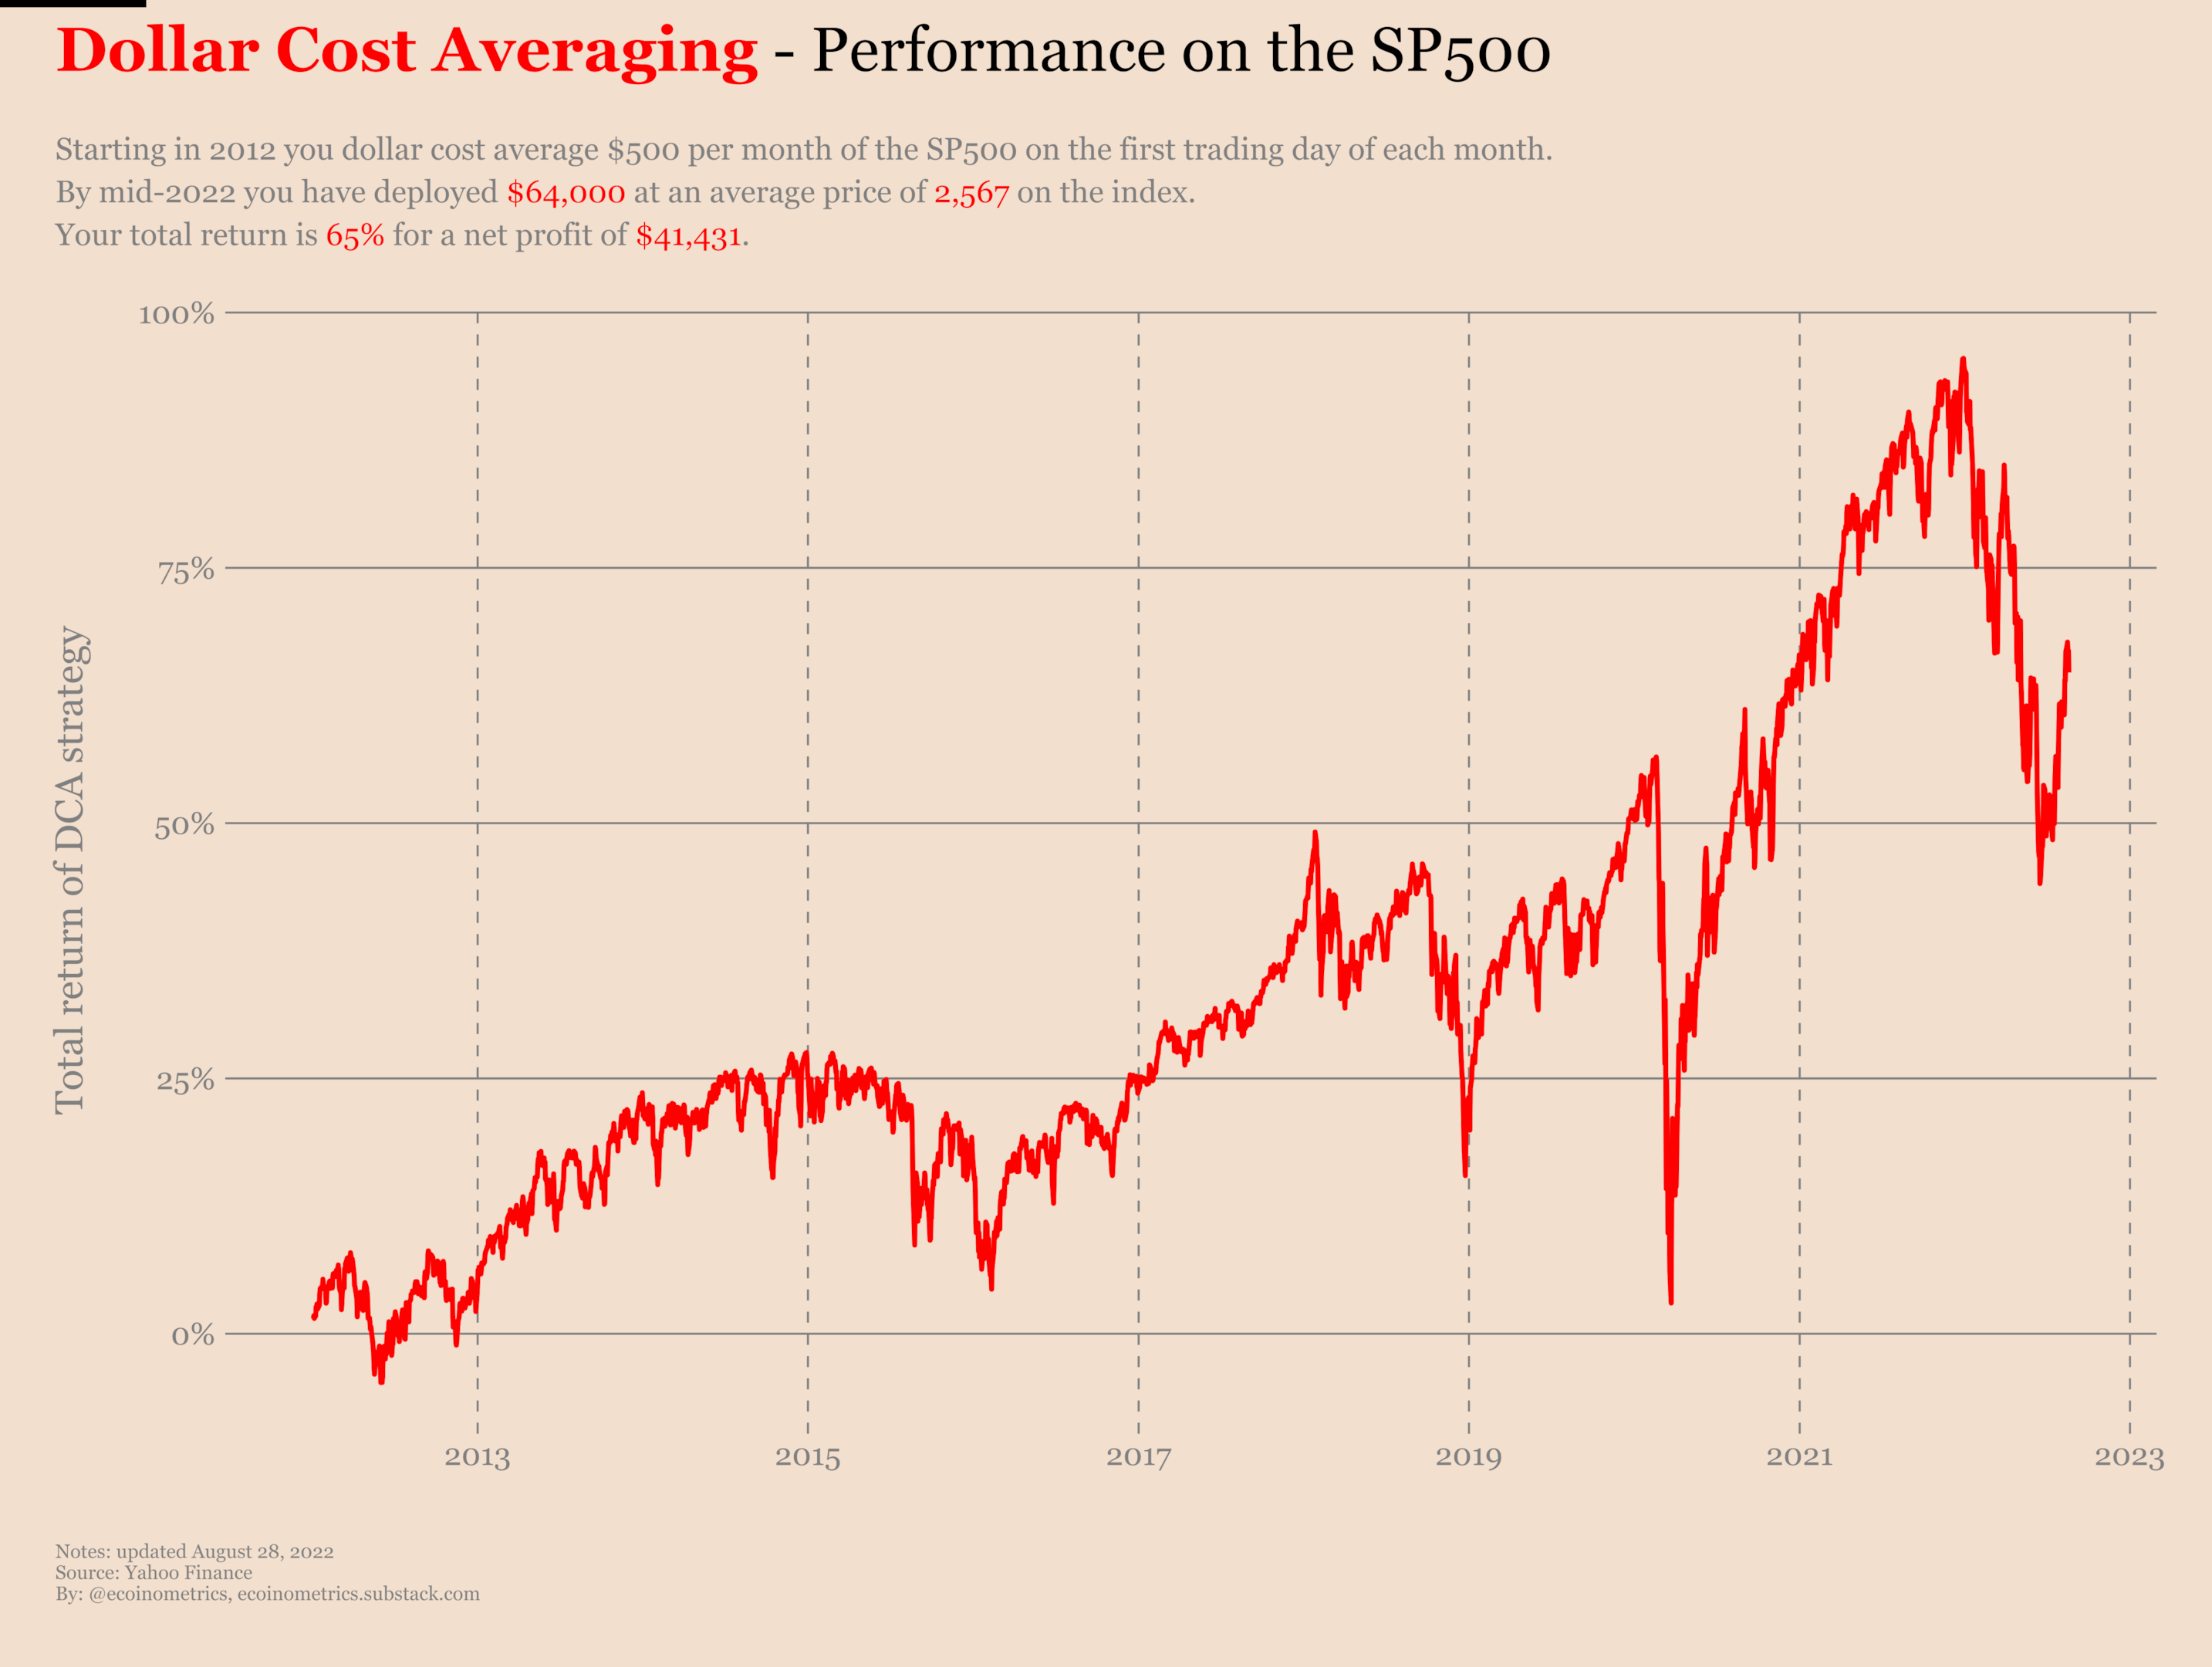
The total amount of money you have deployed on this position is $64,000. You entered at average price of 2,567 on the index. Your total return as of 2022 is 65% which translate in more than $40,000 in net profit.
That's not too shabby. But as you can see this strategy's return isn't a straight line up either. At the time of the COVID dip in March 2020 you would have been dollar cost averaging for 8 years. But the crash would still have almost completely wiped your returns if you had sold at the bottom.
Two lessons from this:
- Investing involves risk. There is no magical strategy that wins all the time.
- Panic selling is not a good strategy, the SP500 did recover. Time in the market is more important than timing the market.
If you want to go deeper and see how dollar cost averaging the SP500 can net you $1 million dollars, go check out this article with a DCA calculator.
Example of dollar cost averaging Amazon
Stock indices are probably the least risky assets you can dollar cost average. But if you want to invest in particular stocks you can of course do that too.
Here is our investment plan for Amazon:
- We are investing a fixed amount of $100 on AMZN.
- We do that weekly every Monday (skip the week if Monday was a stock market holiday).
Say you started doing that in 2002, how much money would you have deployed and for what kind of returns?
Once more let's crunch the numbers.
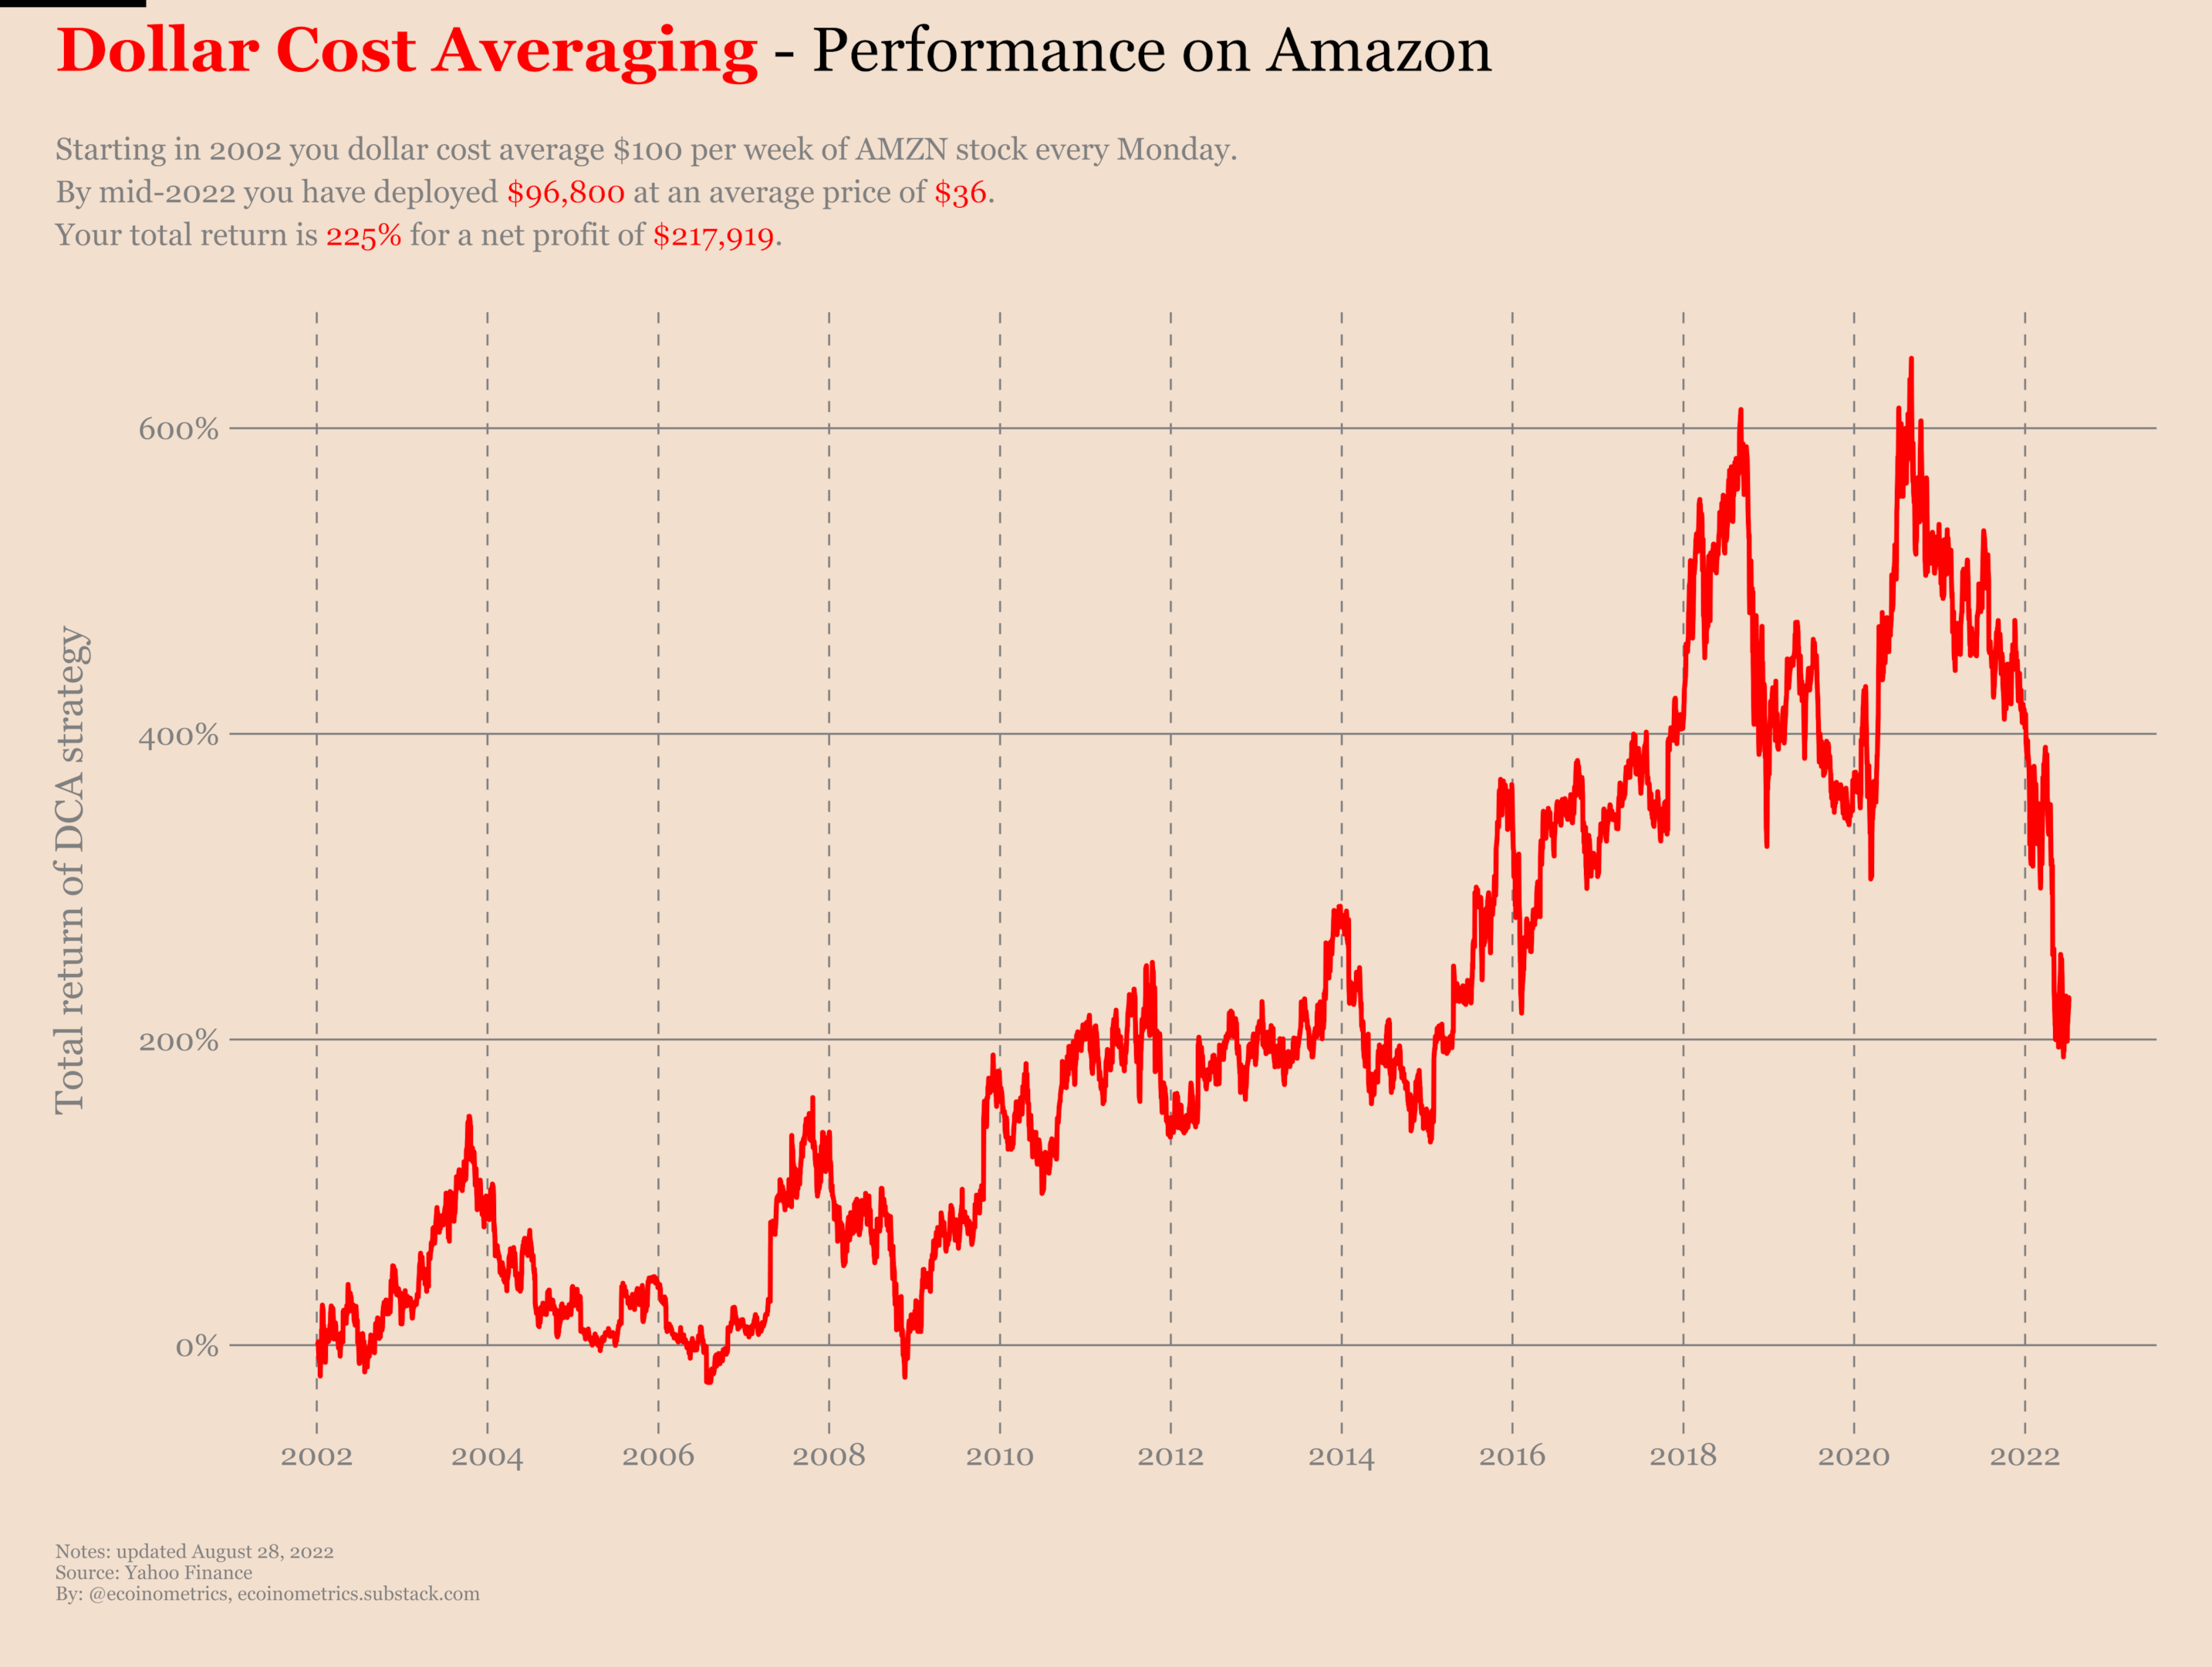
Over twenty years of dollar cost averaging Amazon every week you would have deployed almost $100,000 to invest in AMZN at an average price of $36 per share. Your total returns would be 225% for net profit of almost $220,000.
As you can see from the evolution of the total returns, you aren't guaranteed profits straight away. And even though you'd still be up 225% in the middle of the current bear market, you had the occasion to exit your position at a much higher return. Both in 2018 and later in 2021 you could have sold for a 600% return.
Moral of the story, you aren't bound to dollar cost average forever. If you see a good occasion to take profit you can definitely do it.
Now dollar cost averaging applies to any asset you might want to own, not only stocks. So let's take a look at the crypto market.
Example of dollar cost averaging Bitcoin
So we have seen an example of index fund and an example of specific stock. Moving in the opposite direction from say a mutual fund we have cryptocurrencies. If you are going to dollar cost average something in the crypto space it probably has to be Bitcoin.
As we have seen in the other two examples it can take time for a dollar cost averaging strategy to produce returns. That means you want to invest on assets that have:
- Long term potential gains.
- A high likelihood of being around for a long time.
That's why Bitcoin is the prime candidate for DCA in the crypto space.
So here is our dollar cost averaging plan for Bitcoin:
- We are investing a fixed amount of $100 on Bitcoin.
- We do that every Monday (which is truly weekly since Bitcoin is trading 24/7).
If you had started doing that in 2012, how much would you have now.
Once more we have crunched the numbers for you. Here is the result.
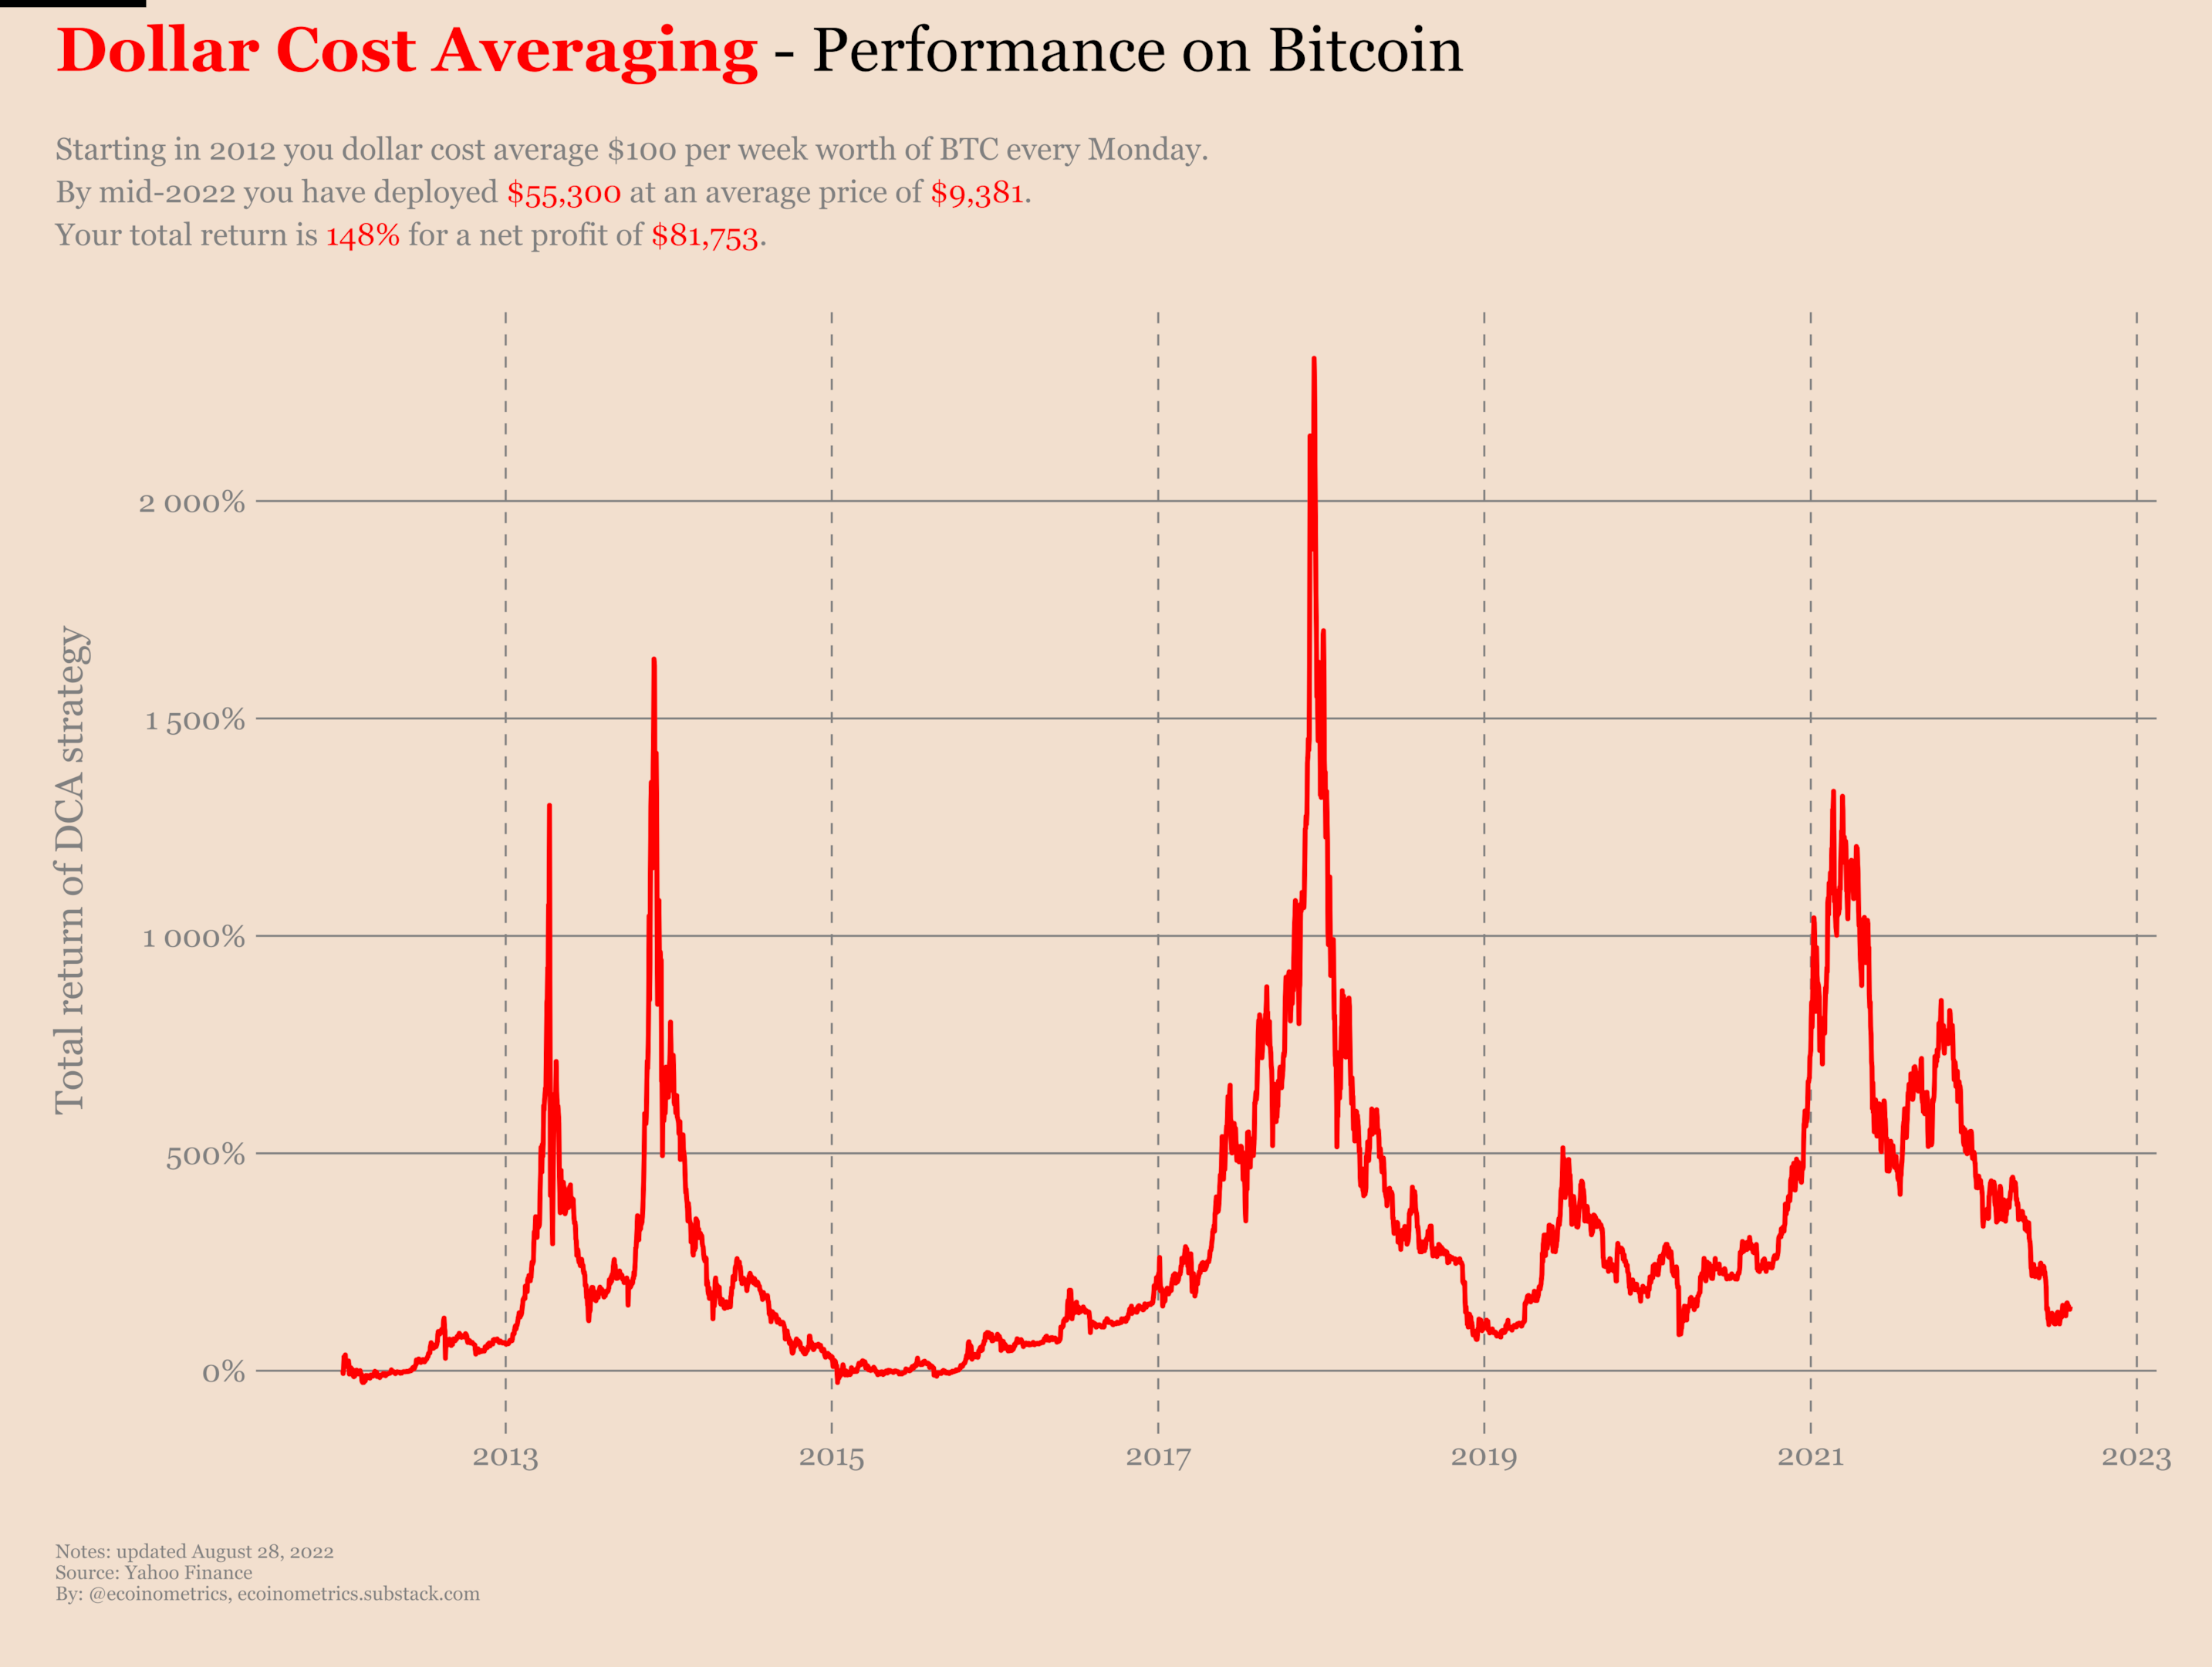
After ten years of dollar cost averaging Bitcoin on a weekly basis you would have deployed $55,000 to own BTC at an average $9,000 price. In the middle of this bear market your total returns are 148% for a net profit of about $80,000.
But as you can see on the chart this ten years journey has involved a lot of volatility. And at some point your position was up more than 2,000%. So that must mean just DCA is not necessarily always the best investment advice in any situation.
Which brings us to the following question: is dollar cost averaging the best way to invest?
Is dollar cost averaging the best way to invest?
No, dollar cost averaging isn't the best way to invest. Let's go through an example that I think will convince you.
We are in January 2012 and you are given two options:
- You can dollar cost average the SP500 for $500 every month.
- You can invest a lump sum of $10,000 in the SP500 right now and sit on it.
Same stock index, different approach. DCA vs lump sum investment, how do these two strategies compare?
When we crunch the numbers we find the following result. Take a look.
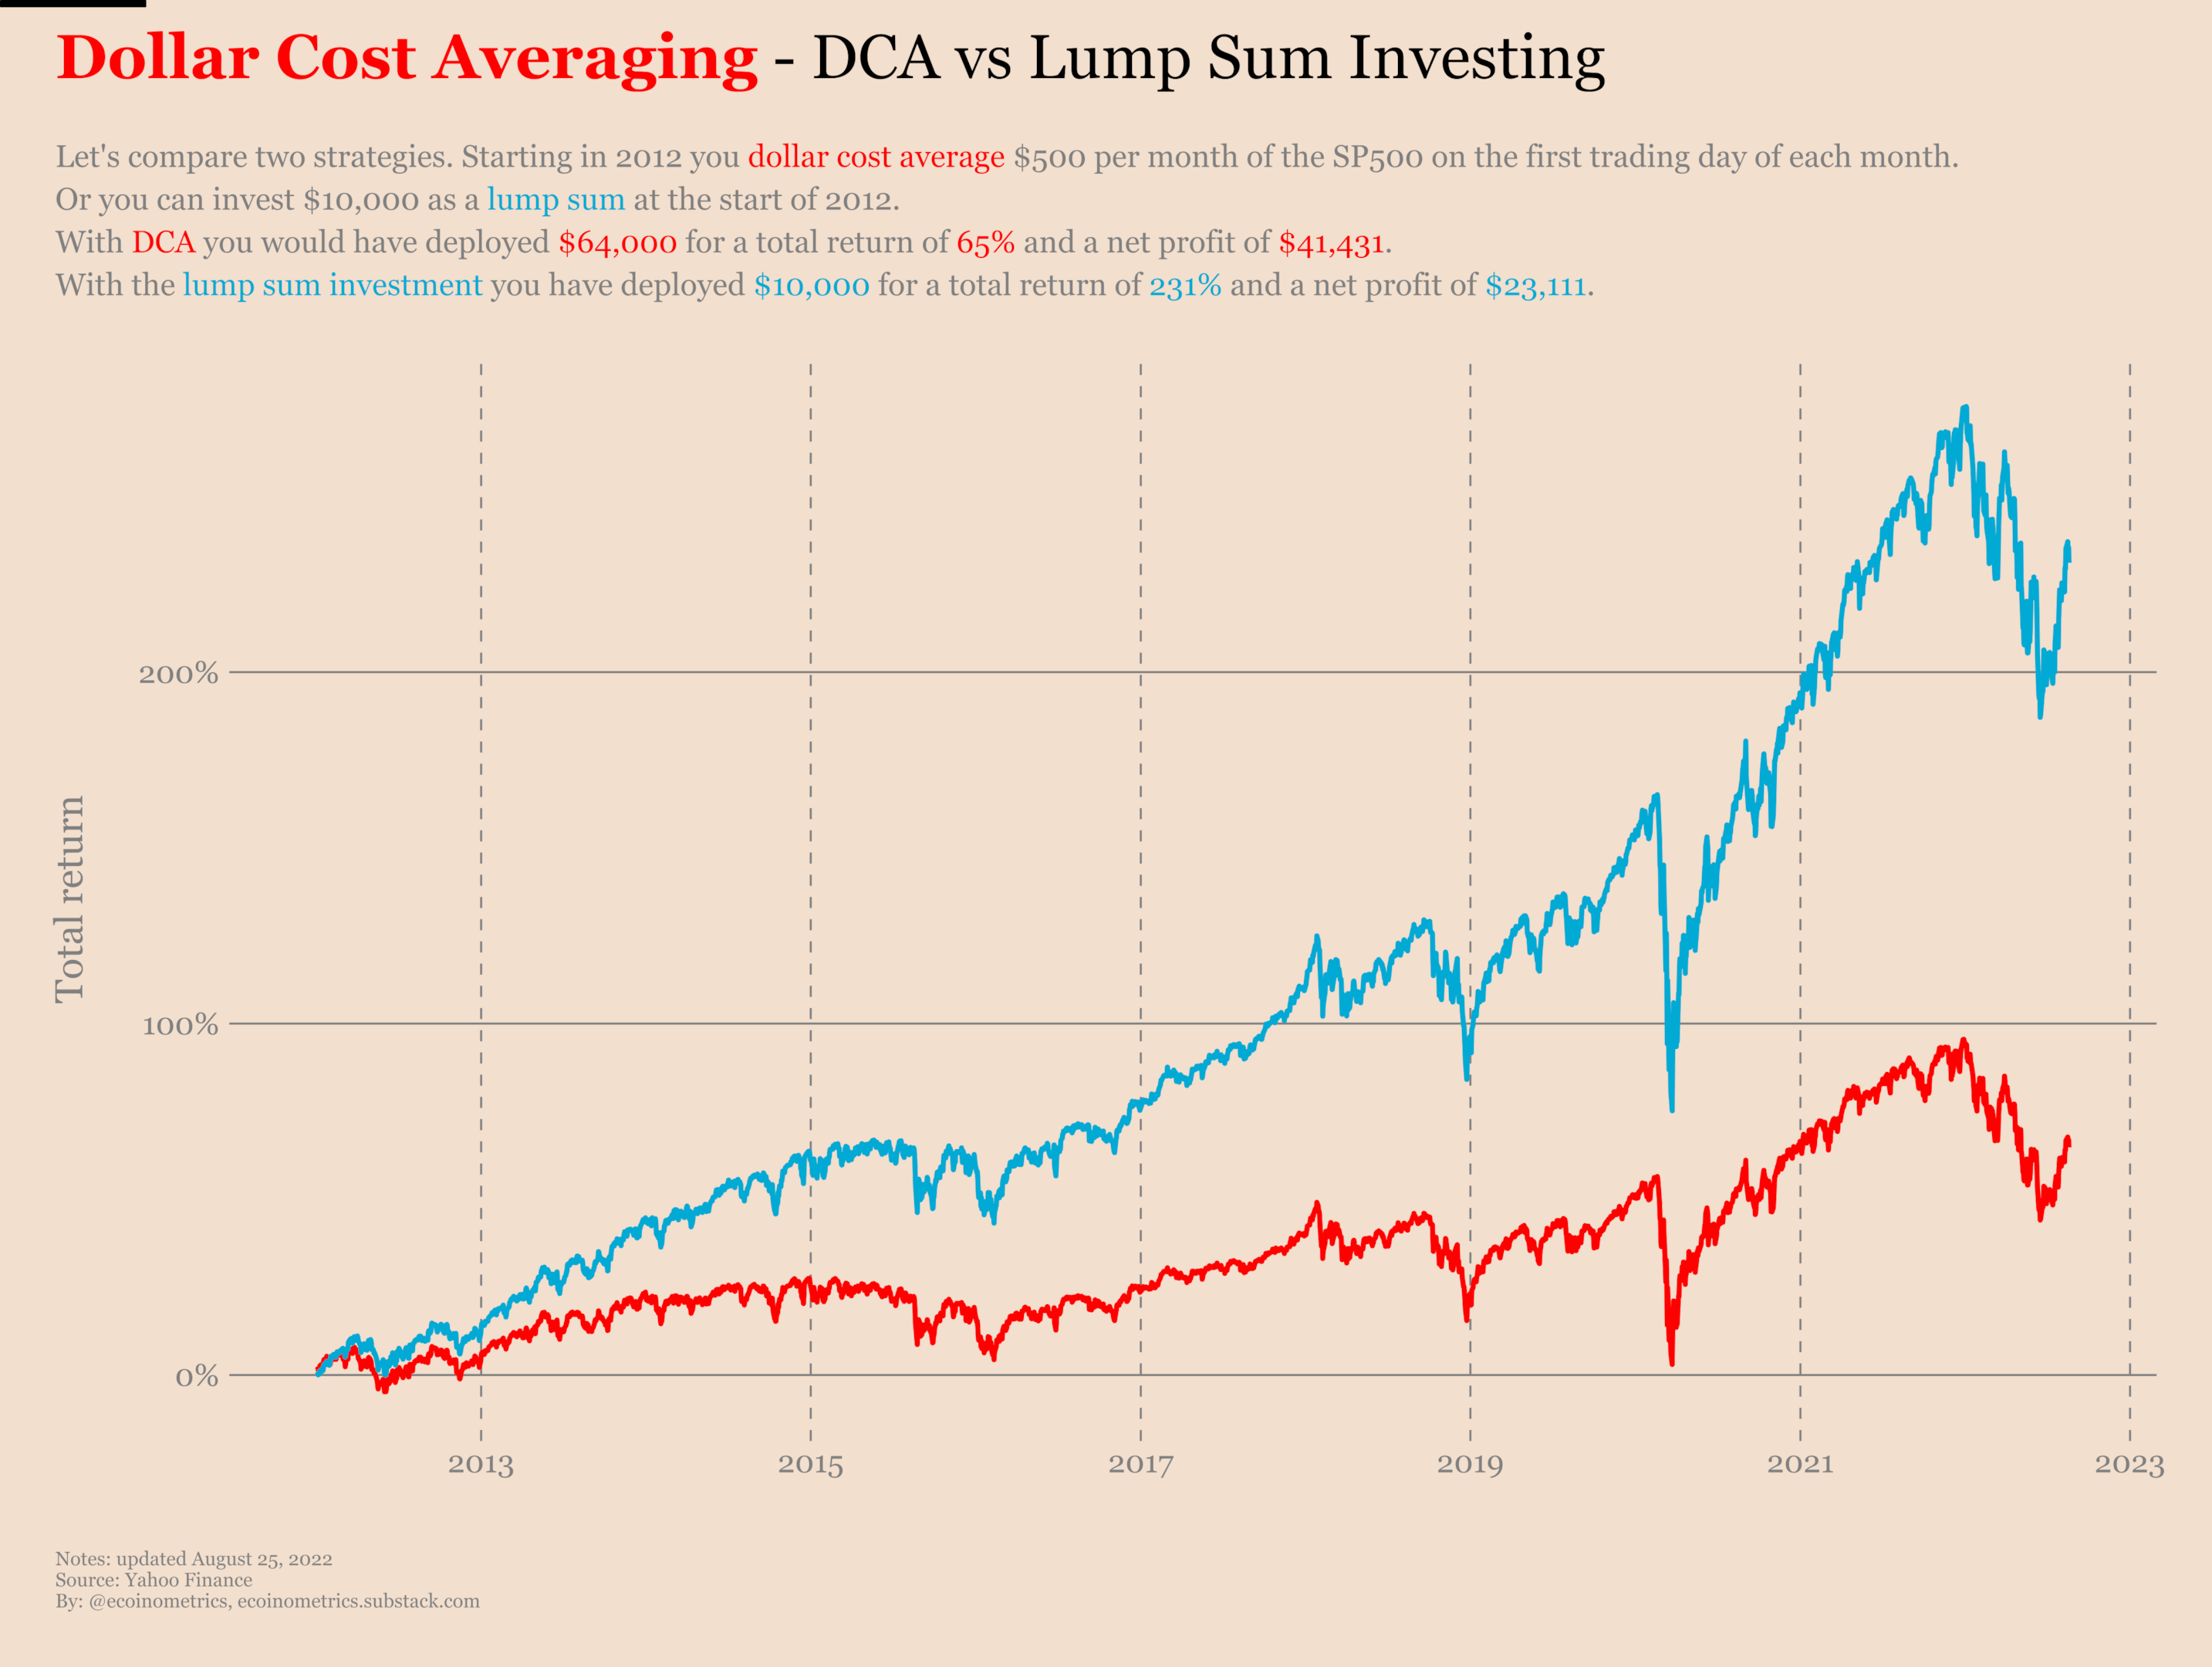
The dollar cost averaging strategy would have netted you $41,000 in profit for $64,000 invested while the lump sum investing strategy would have generated $23,000 in profit for $10,000 invested. That's a 65% return vs a 231% return.
So obviously if we are gauging the performance of our investment strategy based on pure return on investment dollar cost averaging is not necessarily the best option. By investing a lump sum you would have had to deploy less capital to generate the same amount of net profit as the dollar cost averaging approach.
Moral of the story, if you have a some capital ready to be deployed lump sum investing performs better than DCA.
But there is a way to improve the return on investment of DCA. And it boils down to one question.
How long should you do dollar cost averaging?
Up to this point we have assumed that you start DCA and never stop. But it doesn't have to be this way.
With dollar cost averaging you are building a position over time. But once your position is large enough you can decide to stop buying and just ride the wave. In fact this is what you want to do if your goal is to maximize your return on investment.
Compare three different scenario on the SP500:
- Starting in 2012, DCA $500 monthly.
- Starting in 2012, DCA $500 monthly until you have deployed $10,000.
- Starting in 2012, you buy deploy a lump sum of $10,000.
Fast forward to mid-2022 and you get the following performance for each scenario.
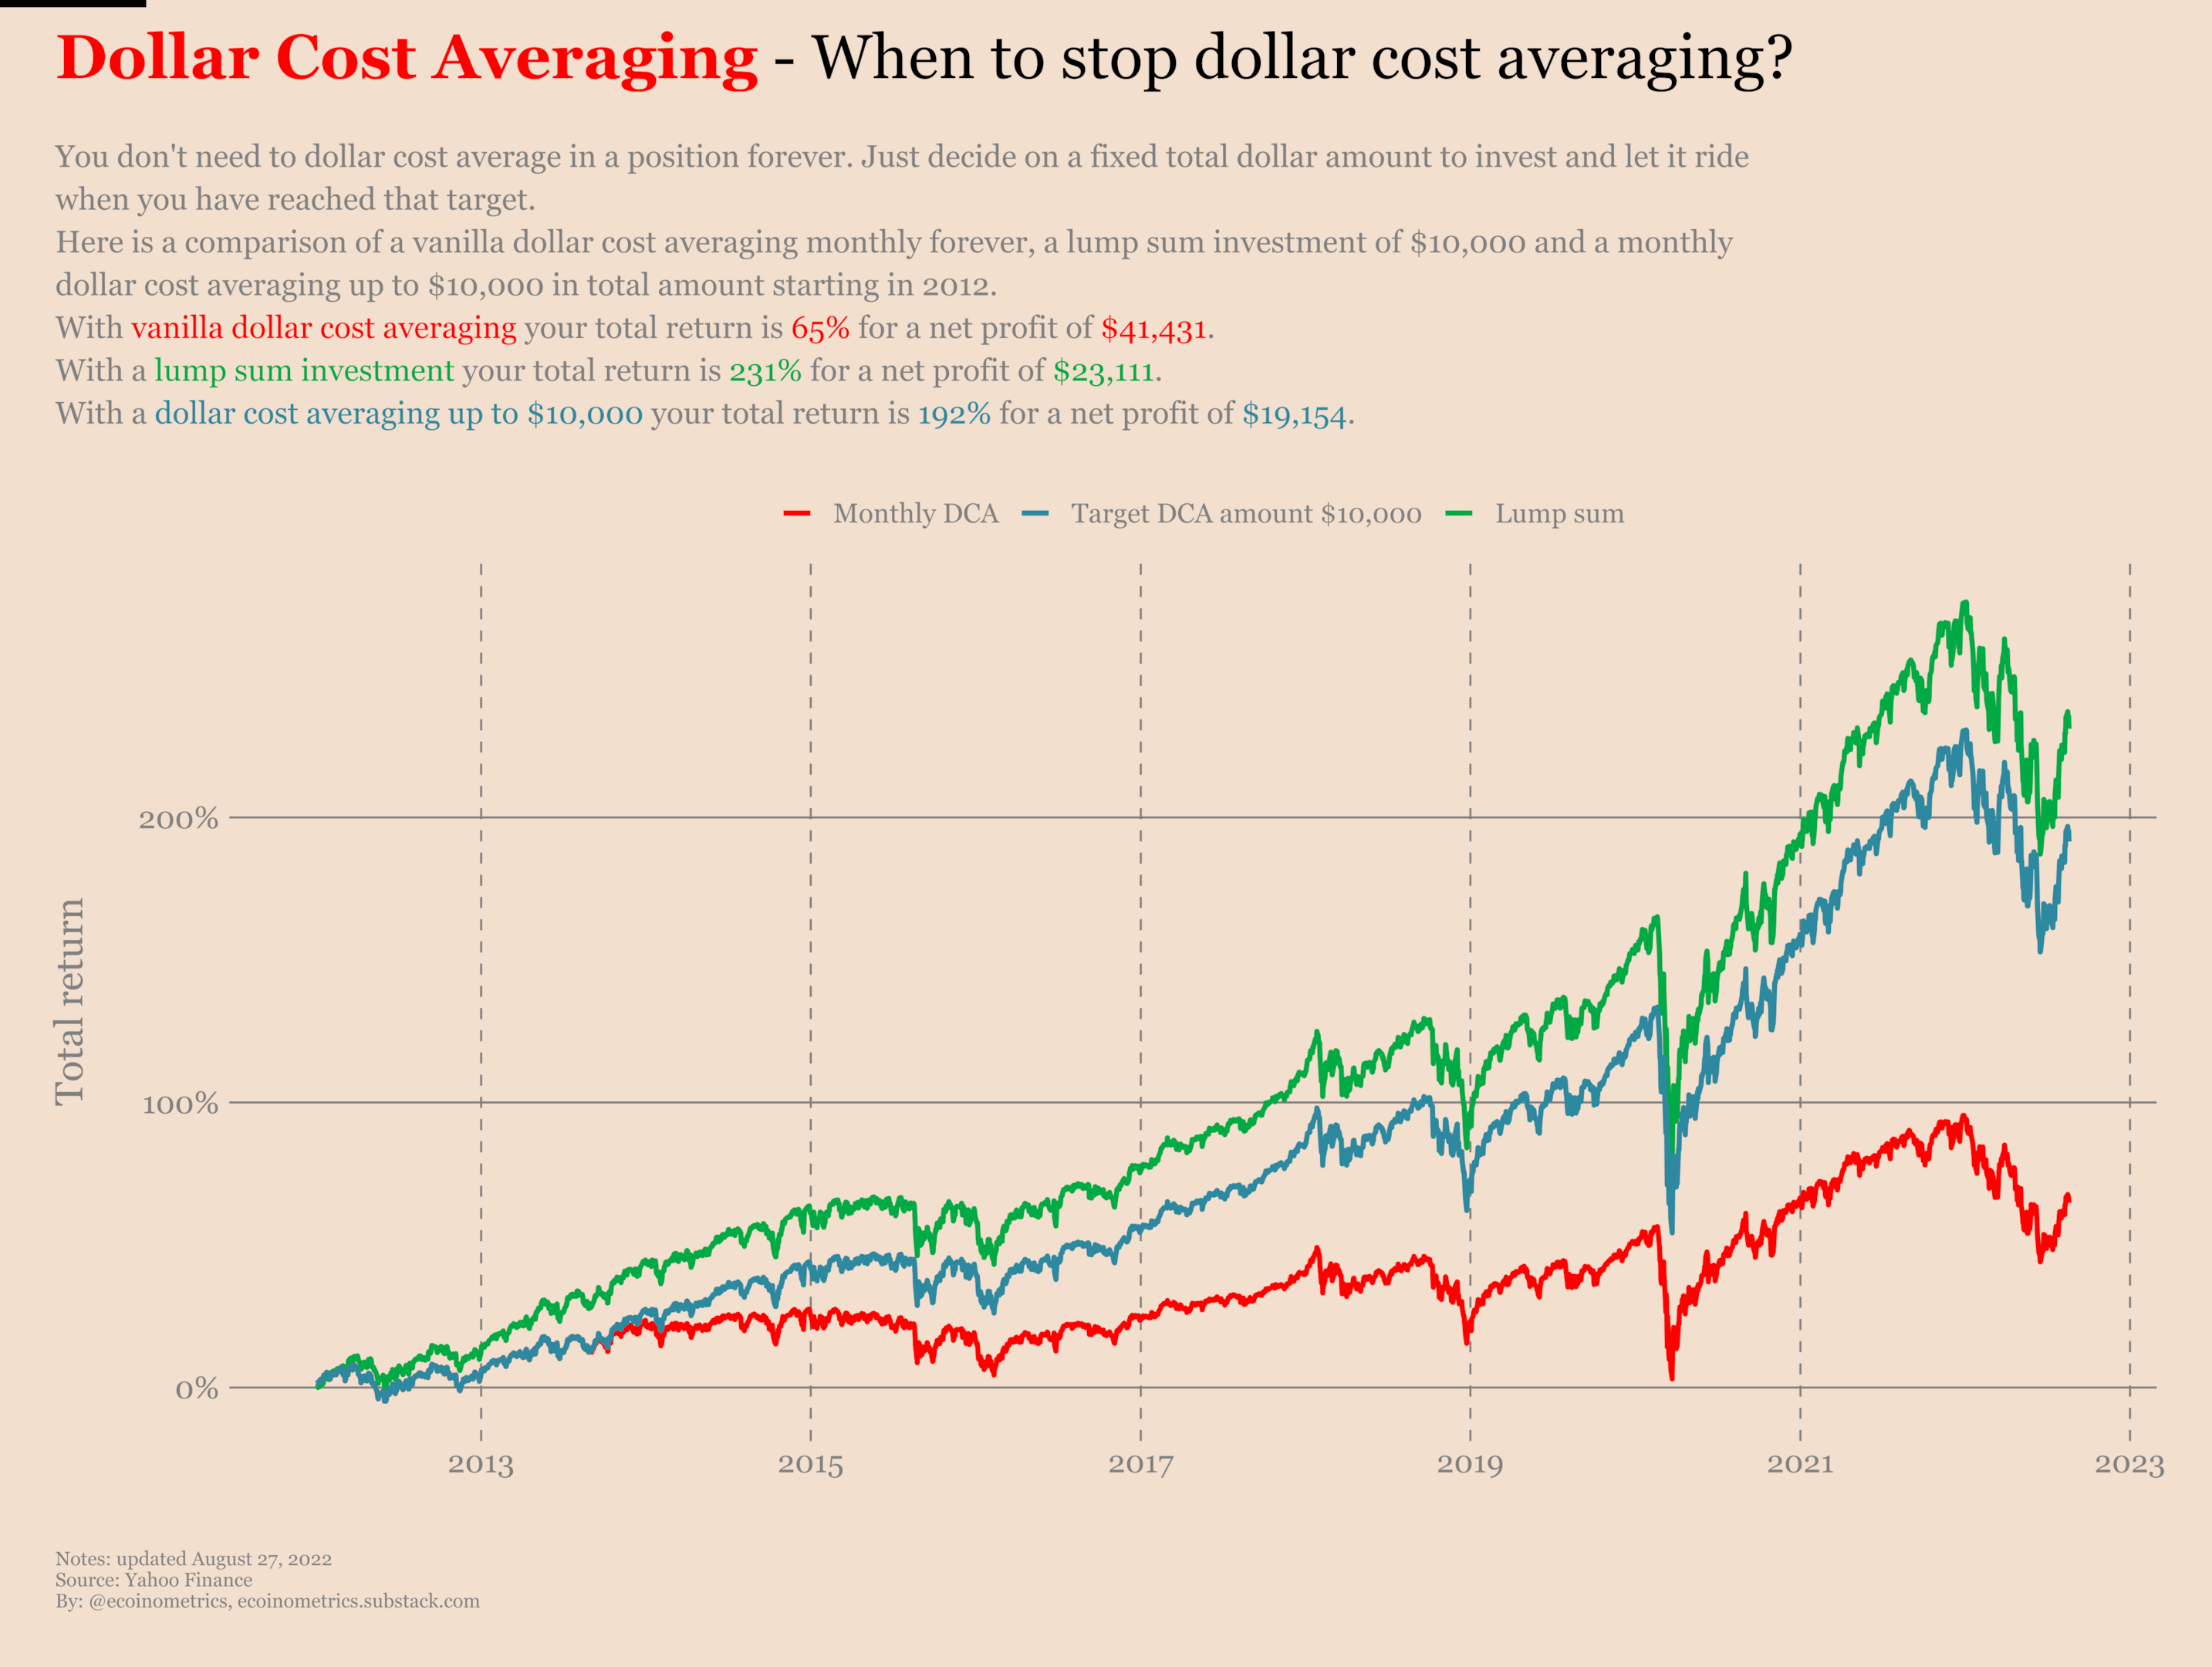
As you can see lump sum investing beats everything else in terms of returns on investment. But DCA until you have reached a fixed amount deployed is pretty close.
The reason for that is total returns depend on the average price at which you entered your position. So while the SP500 is continuously appreciating over the long term horizon continuing to DCA will raise your average price and this lower your returns in percentage terms.
So you need to decide what is your goal:
- Dollar cost averaging forever has a lower return on investment but gives you larger net returns in dollar amount. This is basically a savings strategy with some upside.
- Dollar cost averaging up to a fixed amount deployed is as close as you will get to lump sum investing over a long time horizon which means you will get a larger return on investment.
How often should you dollar cost average?
There are two components to your dollar cost averaging strategy: the dollar amount you buy and the frequency at which you do it.
So it is natural to wonder how often you should dollar cost average for optimal performance. Spoiler alert, the answer is that it barely matters.
Let's just look at an example. You start dollar cost averaging the SP500 in 2012. You have three options:
- You can buy $400 monthly.
- You can buy $100 weekly.
- You can buy $20 daily.
Those three options result in about the same dollar amount deployed. So we are purely comparing returns on investment.
We crunched the numbers and here is the result as of mid-2022.
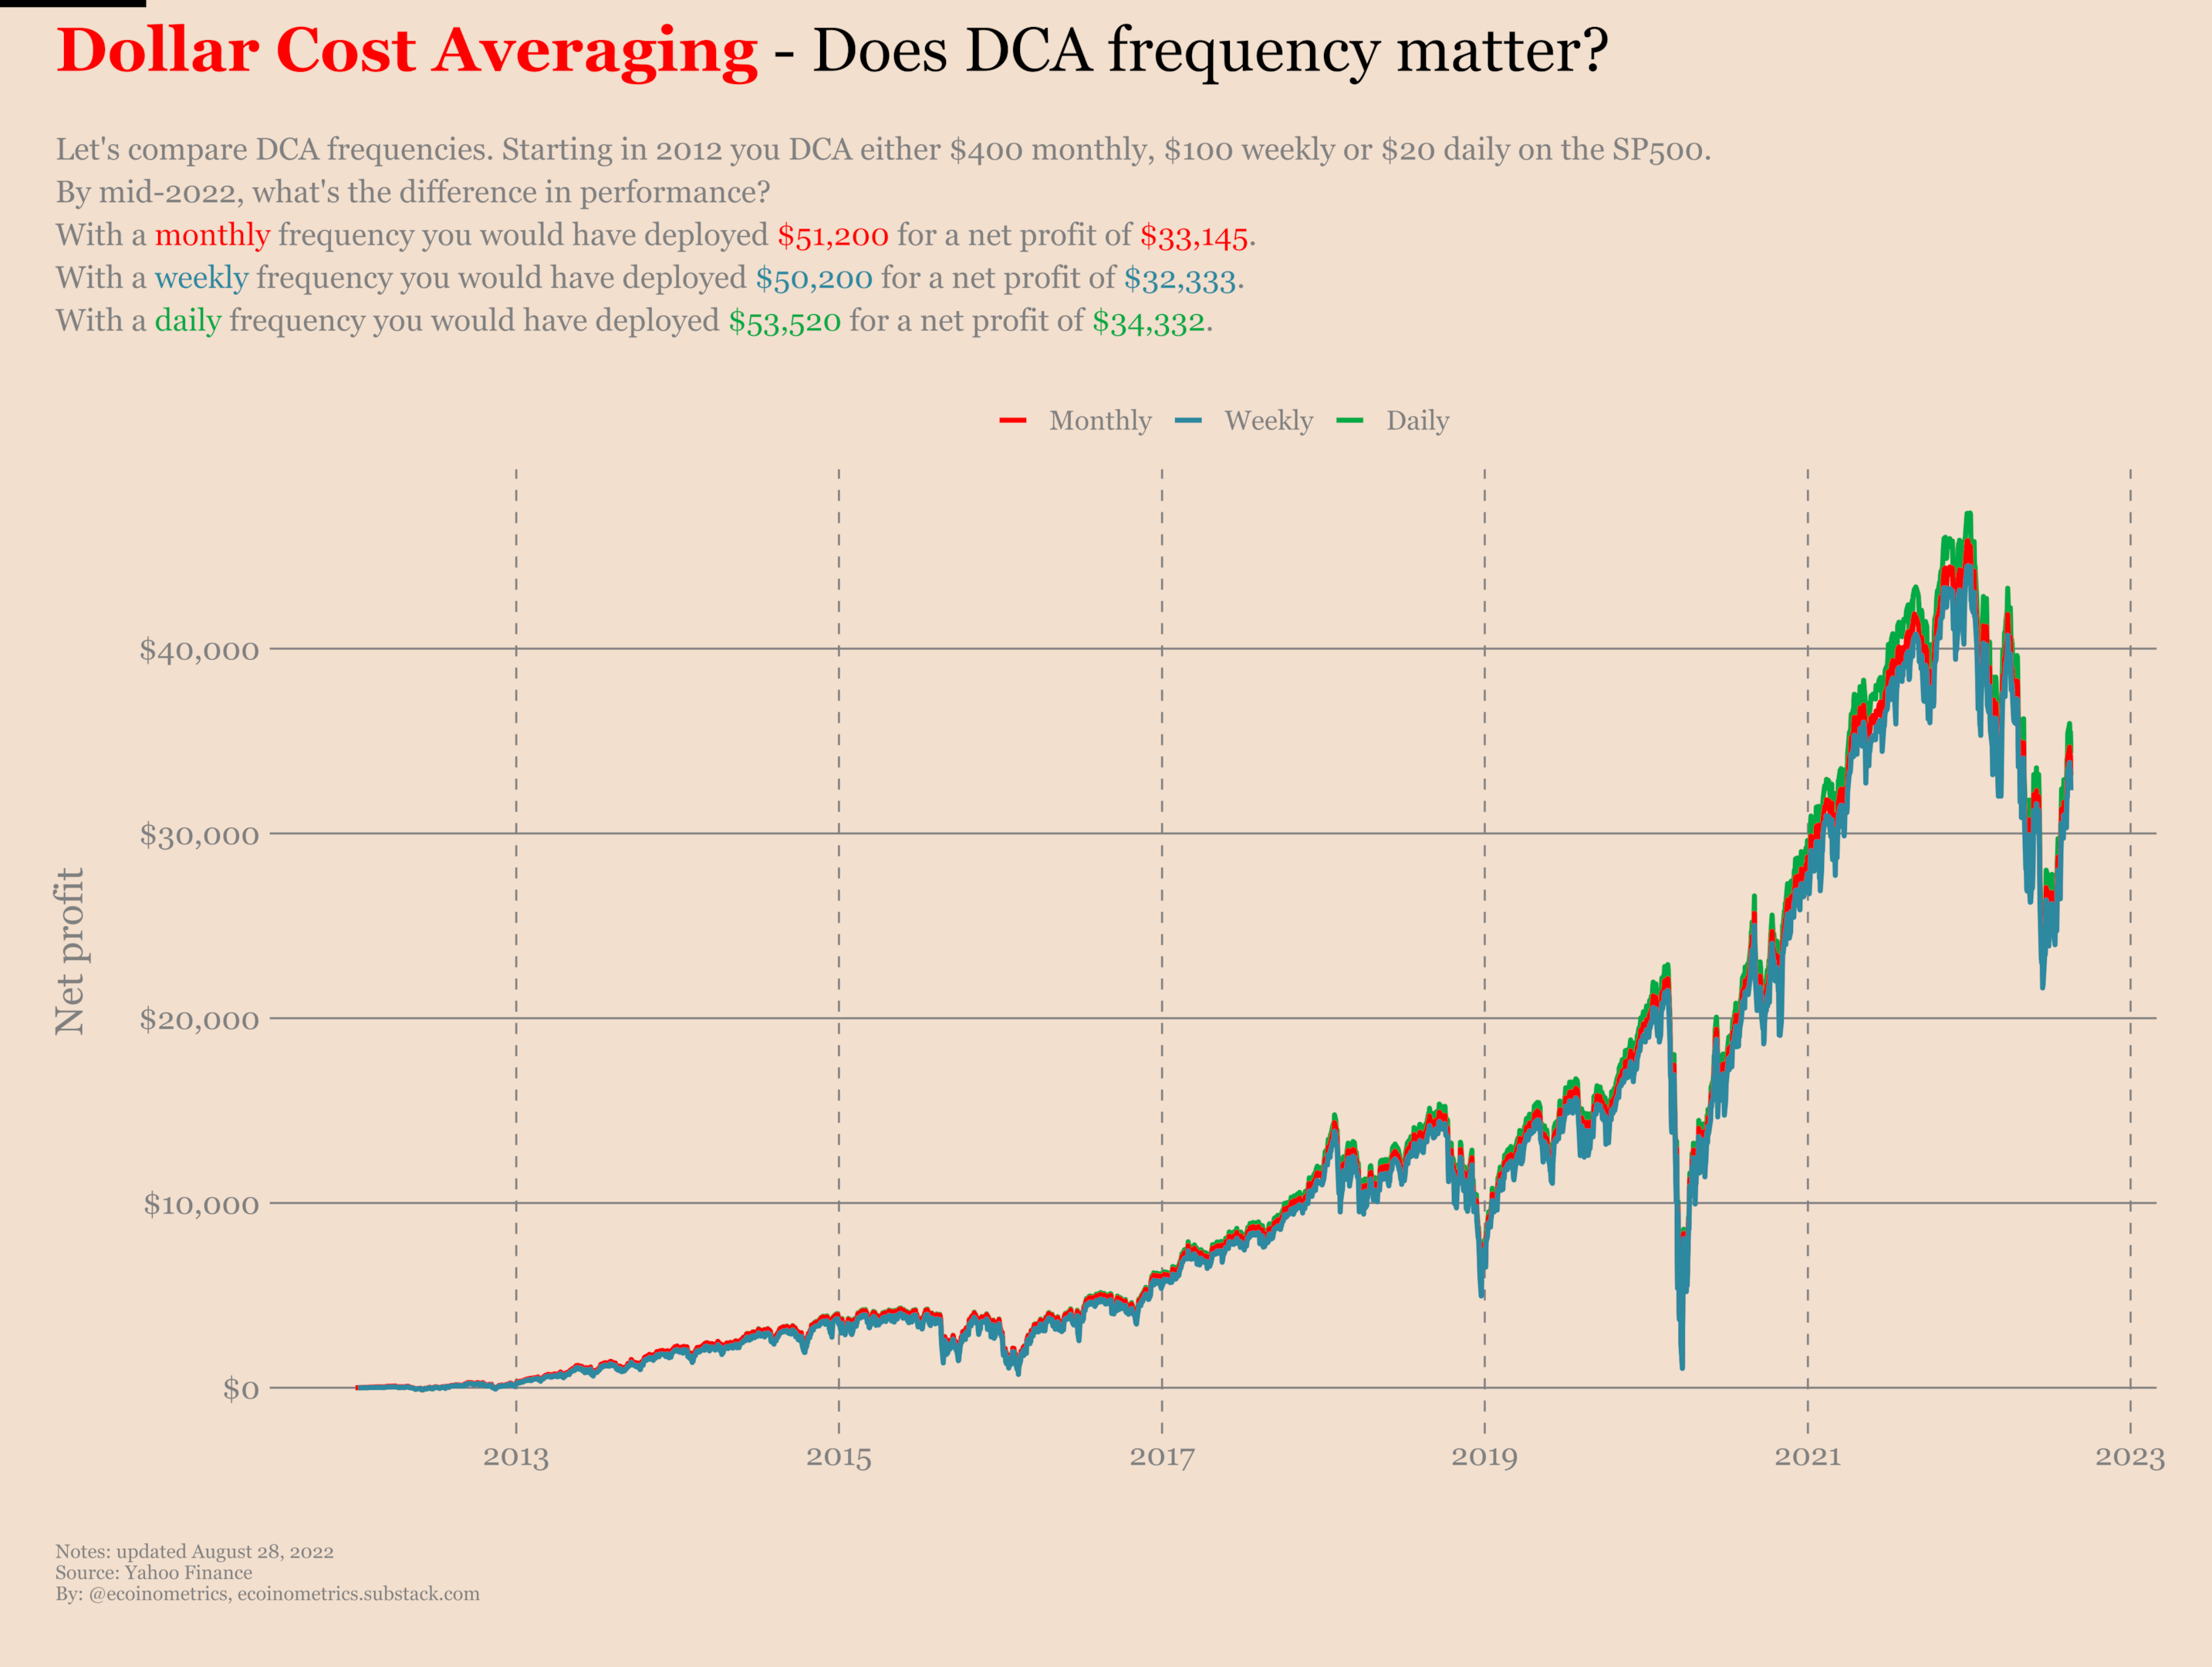
As you can see there is barely any difference between monthly, weekly and daily buys:
- With a monthly DCA you would have deployed $51,200 for a total return of 65%.
- With a weekly DCA you would have deployed $50,300 for a total return of 64%.
- With a daily DCA you would have deployed $53,520 for a total return of 65%.
In summary, there is no material difference between these buying frequencies that range for a daily to monthly. Of course if you are paying flat brokerage fees the higher the frequency the more costly it will be.
But ignoring that you can safely choose whatever is most convenient for you. Most investors tie their buying frequency to their salary and that's perfectly fine. Over the long run those frequencies lead to roughly the same average market price.
What's the best day to dollar cost average?
That's a very common question. But a better question is does the day on which you choose to dollar cost average really matter?
Well let's just look at what the data says on the SP500. Say your DCA plan is to buy $100 of the SP500 on a weekly basis. Let's compare the performance of this plan when we vary the day of the week on which we do this buying.
Take a look at the chart.
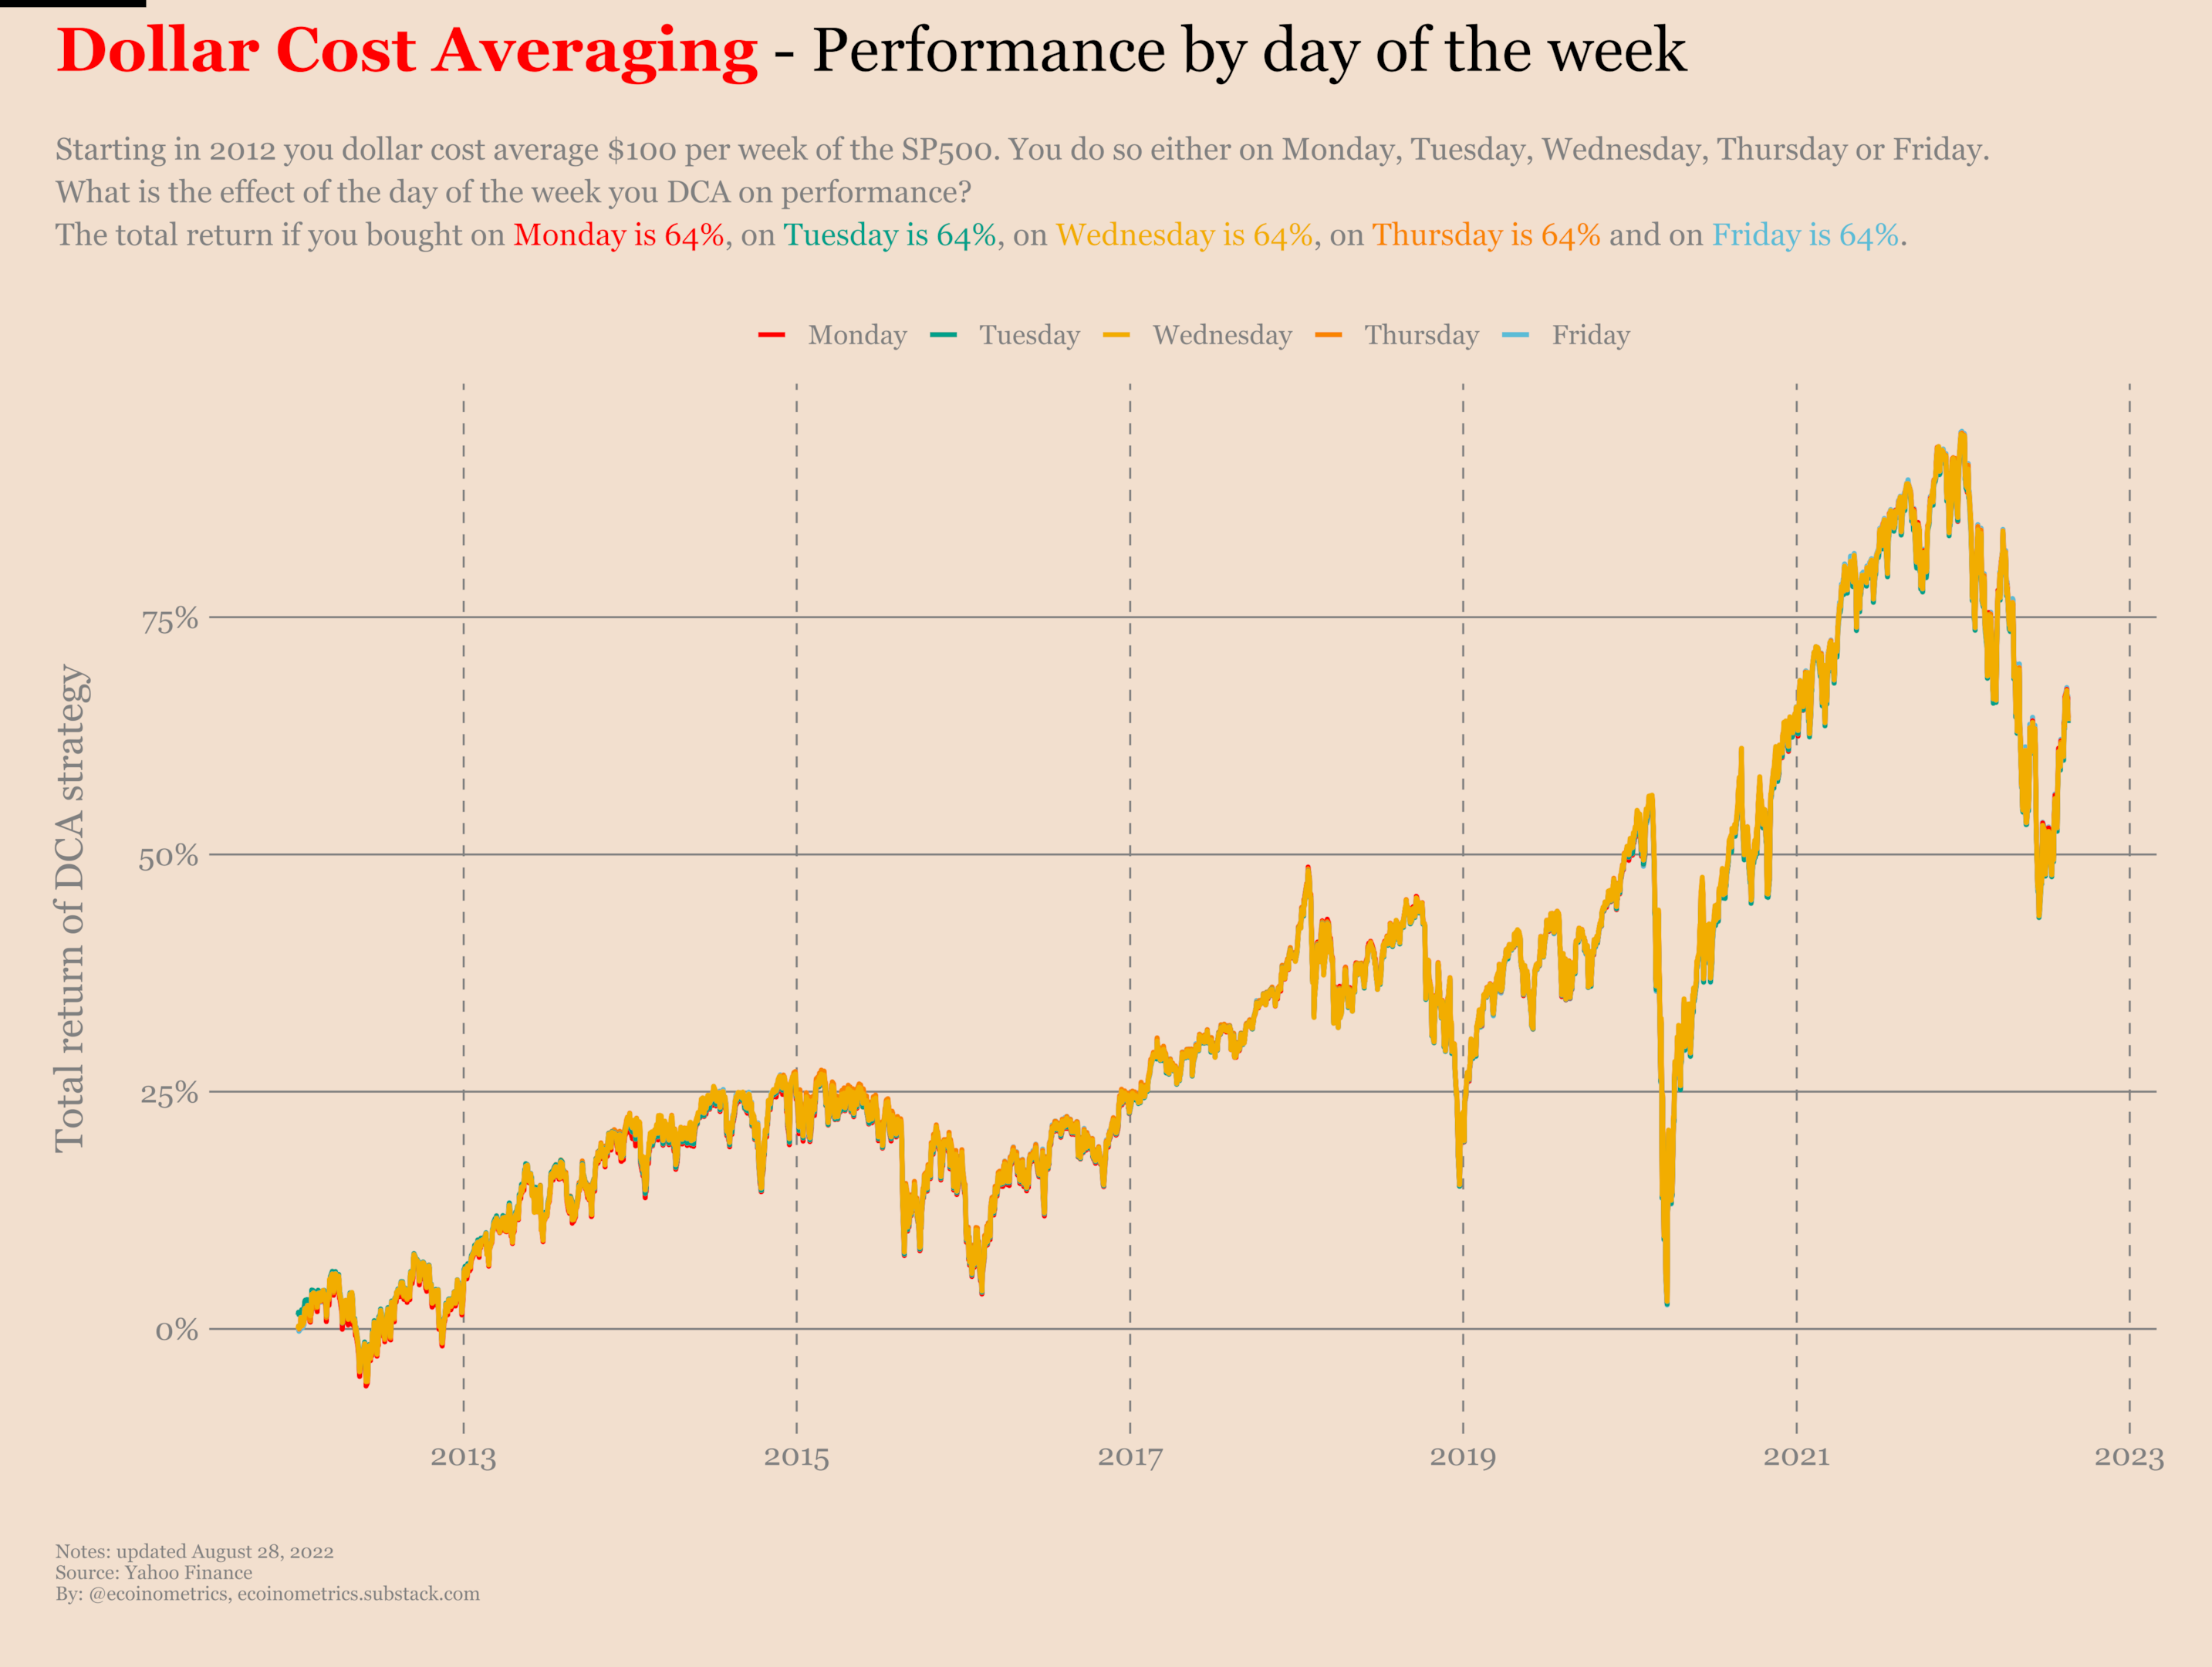
After 10 years of DCA the numbers come as follow:
- If you bought every Monday your total return is 65%.
- If you bought every Tuesday your total return is 64%.
- If you bought every Wednesday your total return is 64%.
- If you bought every Thursday your total return is 64%.
- If you bought every Friday your total return is 65%.
Said differently, in the long run it doesn't matter which day you pick to DCA.
Pros of dollar cost averaging
Dollar cost averaging might not be the best strategy for every investor. But it does have a lot going on for it:
- It allows investors to deploy capital over time.
- It mitigates the market timing risk other kinds of investment strategies suffer from.
- It is simple to execute and can even be easily automated.
- Used as a saving plan it does the job of preserving your capital while providing your with some returns.
Most of the advantages of dollar cost averaging are related to investor psychology. As a systematic investment plan it requires very few decisions from your part and a long term commitment to the asset you picked. These are good things as time in the market beats timing the market.
Disadvantages of dollar cost averaging
As we have seen on the examples above dollar cost averaging has some disadvantages when compared to other investment strategies:
- The return on investment of dollar cost averaging can drastically underperform lump sum investing.
- It is a slow strategy. Since you deploy a relatively small amount of capital every month it can take a long time to reach the point where the returns in dollar amount become substantial.
- By virtue of being a slow strategy DCA does not work on any kind of asset. You need to select something that is likely to be around and grow for a very long time. DCA is not a strategy suitable for short time horizons.
These disadvantages have to do with performance limitations and investment horizon. In itself they are not a deal breaker, they are just constraints you need to be aware of.
So that's it for dollar cost averaging pros and cons. There is no perfect strategy, you just need to be aware of the upside and the downside.
Can dollar cost averaging make you rich?
It depends what you mean by getting rich.
As we have seen in the hypothetical examples we've reviewed DCA the SP500 for 10 year to the tune of $100 per week will have made you save about $80,000. That's nice as savings go but I wouldn't say it qualifies as making you rich.
The reality is that there is only two ways DCA will make you rich:
- If you can afford to DCA a large sum every month your net profit in dollar terms is likely to be substantial.
- If you can DCA up to a fixed amount in an asset that is now growing then you have a potential to ride a big wave and get massive returns.
So can DCA make you rich? Yes. Is it likely? No more than any other investment strategy.
Can you lose money with dollar cost averaging?
Any investment strategy has risks. Dollar cost averaging doesn't work magic. If you DCA while the market declines forever you will lose money.
Case in point, if you have been dollar cost averaging the Deutsche Bank stock since 2002 you are now down -83%. See for yourself.
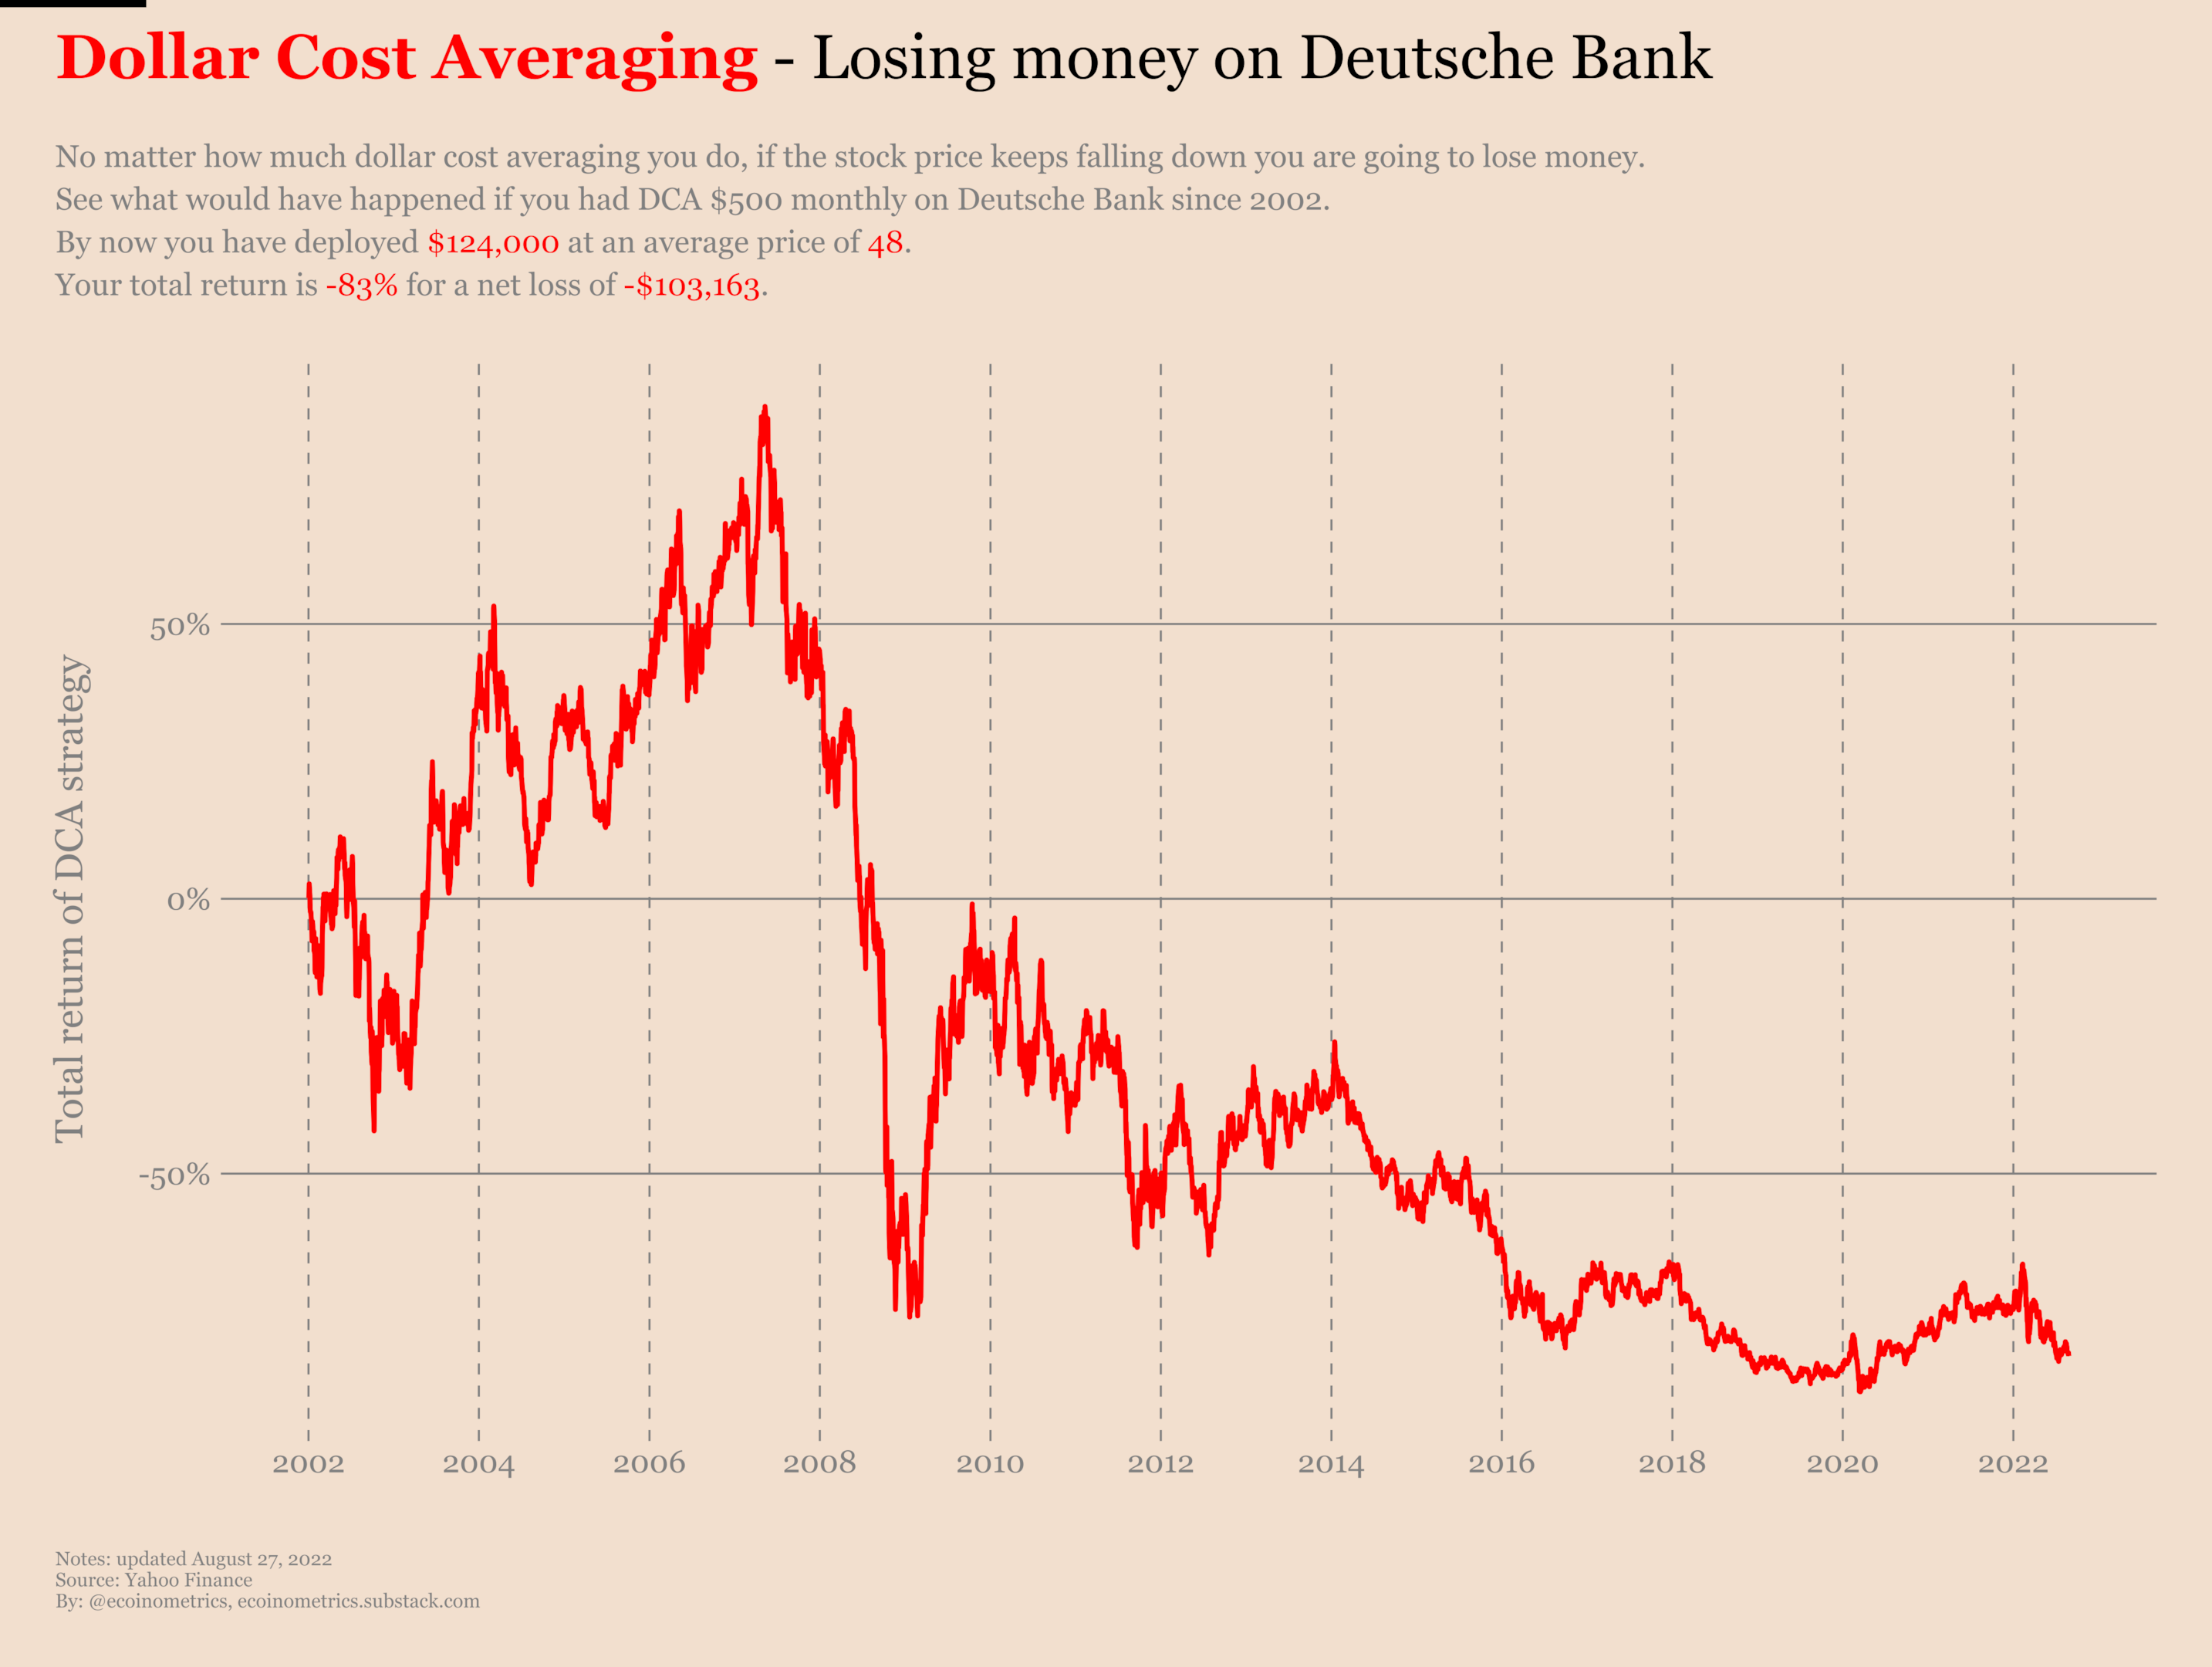
That's why most people will recommend you DCA some index fund or some individual stock that has some long term growth potential.
Is dollar cost averaging right for you?
That's the main question you should ask yourself when you consider dollar cost averaging. The answer depends on what you want to achieve.
Based on our analysis you can go one of two ways.
If your goal is to use dollar cost averaging as a savings strategy with upside you should continue investing regularly for as long as you want and build wealth slowly.
If your goal is to maximize you return on investment your are better off going with a lump sum or DCA until you have deployed a target amount of capital and let your position grow from there.
Regardless of your goal be mindful that DCA doesn't do magic. For this strategy to produce results you must choose to invest in some asset that has a high likelihood of growing over a long period of time.
Ecoinometrics
At Ecoinometrics we help you navigate the landscape of digital assets and macro economics with investment strategies backed by data. Enter your email below to receive our weekly newsletter directly in your inbox.
On top of the regular posts accessible to everyone, paid subscribers get access to:
- All the newsletters (2 every week) and the entire back catalogue.
- All the interactive dashboards, including our Bitcoin on-chain accumulation tracker.
- All the community features including suggestions of charts and research topics.
This is all you need to make strategic investment decisions backed by data.
If you want to know more about it head over here www.ecoinometrics.substack.com.