Make $1 Million Dollars By Dollar Cost Averaging The Stock Market
Can you make $1 million dollars with a strategy of dollar cost averaging the stock market? To answer that question we built a DCA calculator based on 100 years of data.
Dollar cost averaging is known for being a solid investment strategy that can deliver great returns over the long run.
But can you really make a million dollar by dollar cost averaging the stock market? And if yes how long will it take?
Let’s look at the data to try to figure this out. If you want to jump directly to our dollar cost averaging calculator scroll to the bottom of the page.
But first let’s get back to the basics. What is dollar cost averaging (DCA)?
Setting up your dollar cost averaging strategy
Here is the situation. You are starting with nothing. You now have cash coming in every week.
You have decided to get rich by running a dollar cost averaging strategy. For you getting rich means going from $0 to $1m.
Setting up a dollar cost averaging strategy is answering three questions:
- What asset are you going to buy?
- How often are you going to buy it?
- How much dollars are you going to spend on it every time you buy?
Whether you are purchasing stocks, some mutual fund or some stock index, the principle is always the same. Here is an example of what you might do:
- Pick the SP500 index, say through the SPY ETF.
- Decide to buy on a weekly basis, say every Monday.
- Decide to buy whatever $150 afford you in SPY shares.
Note that this is a pretty reasonable example of DCA parameters.
Most people put money in a stock market index and leave it there until they retire. A monthly investment or a weekly investment schedule is the most common option but regardless we have shown over here that whether you DCA daily, weekly or monthly, the long term performance of your investment is going to be pretty much the same. Finally the median weekly salary in the US is about $1,000. So assuming you put $150 or 15% of your weekly salary on an investment isn’t stretching it.
If you were to DCA that amount over 10 years your total cost would be $78,000. That seems totally reasonable.
All that to say, this particular example is representative of what most people can expect to afford.
For of how to calculate dollar cost averaging, some dollar cost averaging formula or the importance of the purchase costs in analyzing this strategy head over here. In this article we are focusing on a single goal: getting to $1 million dollar.
Now the promise of dollar cost averaging is that you just have to stick to it long enough and you should be able to accumulate $1 million. But how long is “long enough”?
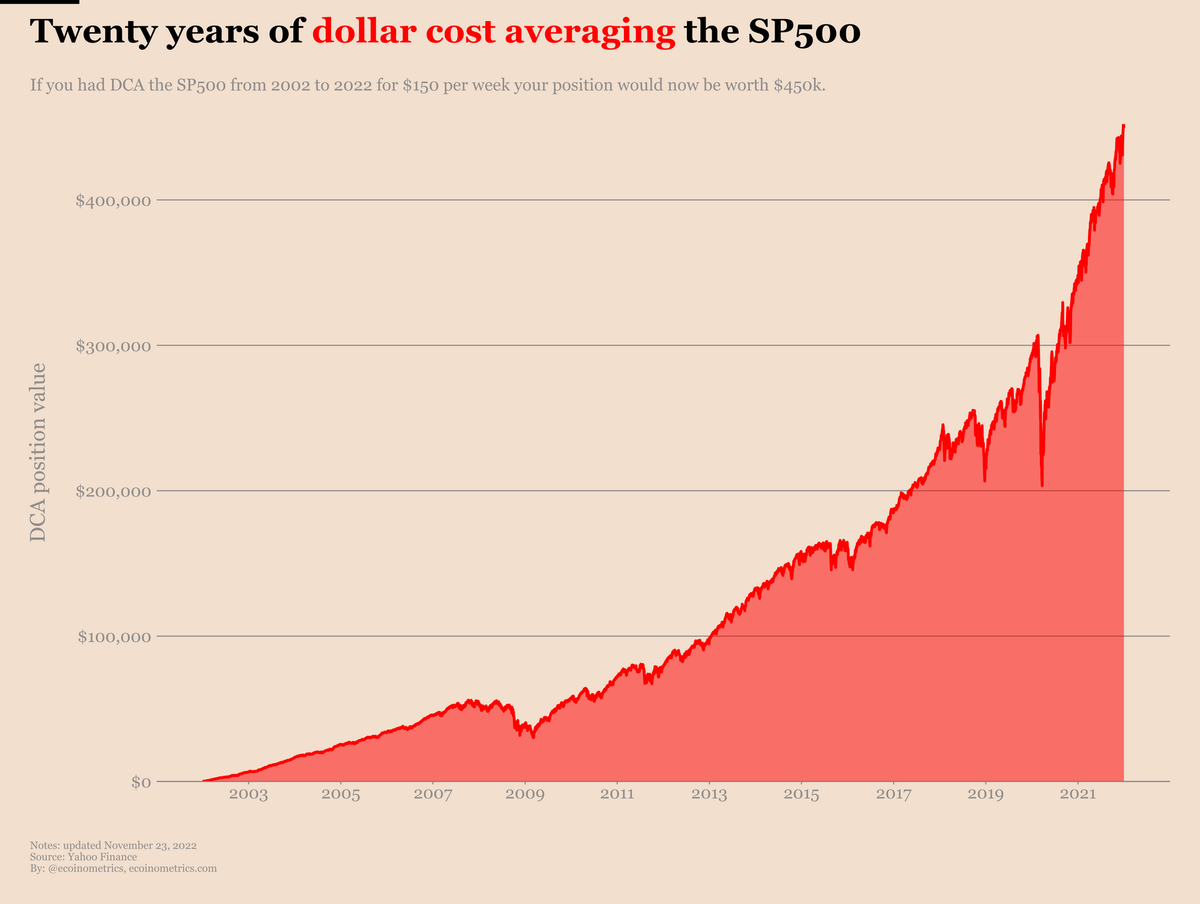
If you had run this DCA strategy from 2002 to 2022 you position in the SP500 would now be worth $450k. That is by dollar cost averaging the stock market weekly over the past 20 years you are a little below halfway from your $1 million goal.
You can see the evolution of the value of your position over that period on the chart below.

So dollar cost averaging the stock market for a reasonable amount every week over 20 years nets you a nice amount of savings.
But $450k isn't even close to one million dollar. Which begs the question, how much does it takes to dollar cost average a stock market index to a total value of $1 million?
Historical performance of dollar cost averaging the stock market
Before we look at how long it will likely take you to dollar cost average the SP500 all the way to $1 million in the future it is worth looking at what it would have taken to achieve that in the past.
For that the SP500 is great because it has a very long history. We can investigate this question by going back 100 years.
But how are we going to proceed?
To simplify things we are going to assume a weekly frequency of DCA, say every Monday (if the stock market was open on that day).
We have analyzed here that which day of the week you decide to buy doesn’t matter over the long run. And similarly buying daily, weekly or monthly doesn’t result in any significant change in total performance of the strategy over the long run.
So assuming a weekly DCA isn’t going to change the result of this historical analysis by much.
Now that this parameter is fixed there are two more things that are in our control:
- How much to buy on a weekly basis.
- What historical period do we want to cover.
Instead of picking those two values for you, you can explore what’s possible yourself by adjusting the parameters below. Give it a try.
Now if we go back to our standard assumption of $150 per week, we can plot the distribution of the number of years it took to get to $1 million over the past 100 years. You can see the result on the following distribution chart.
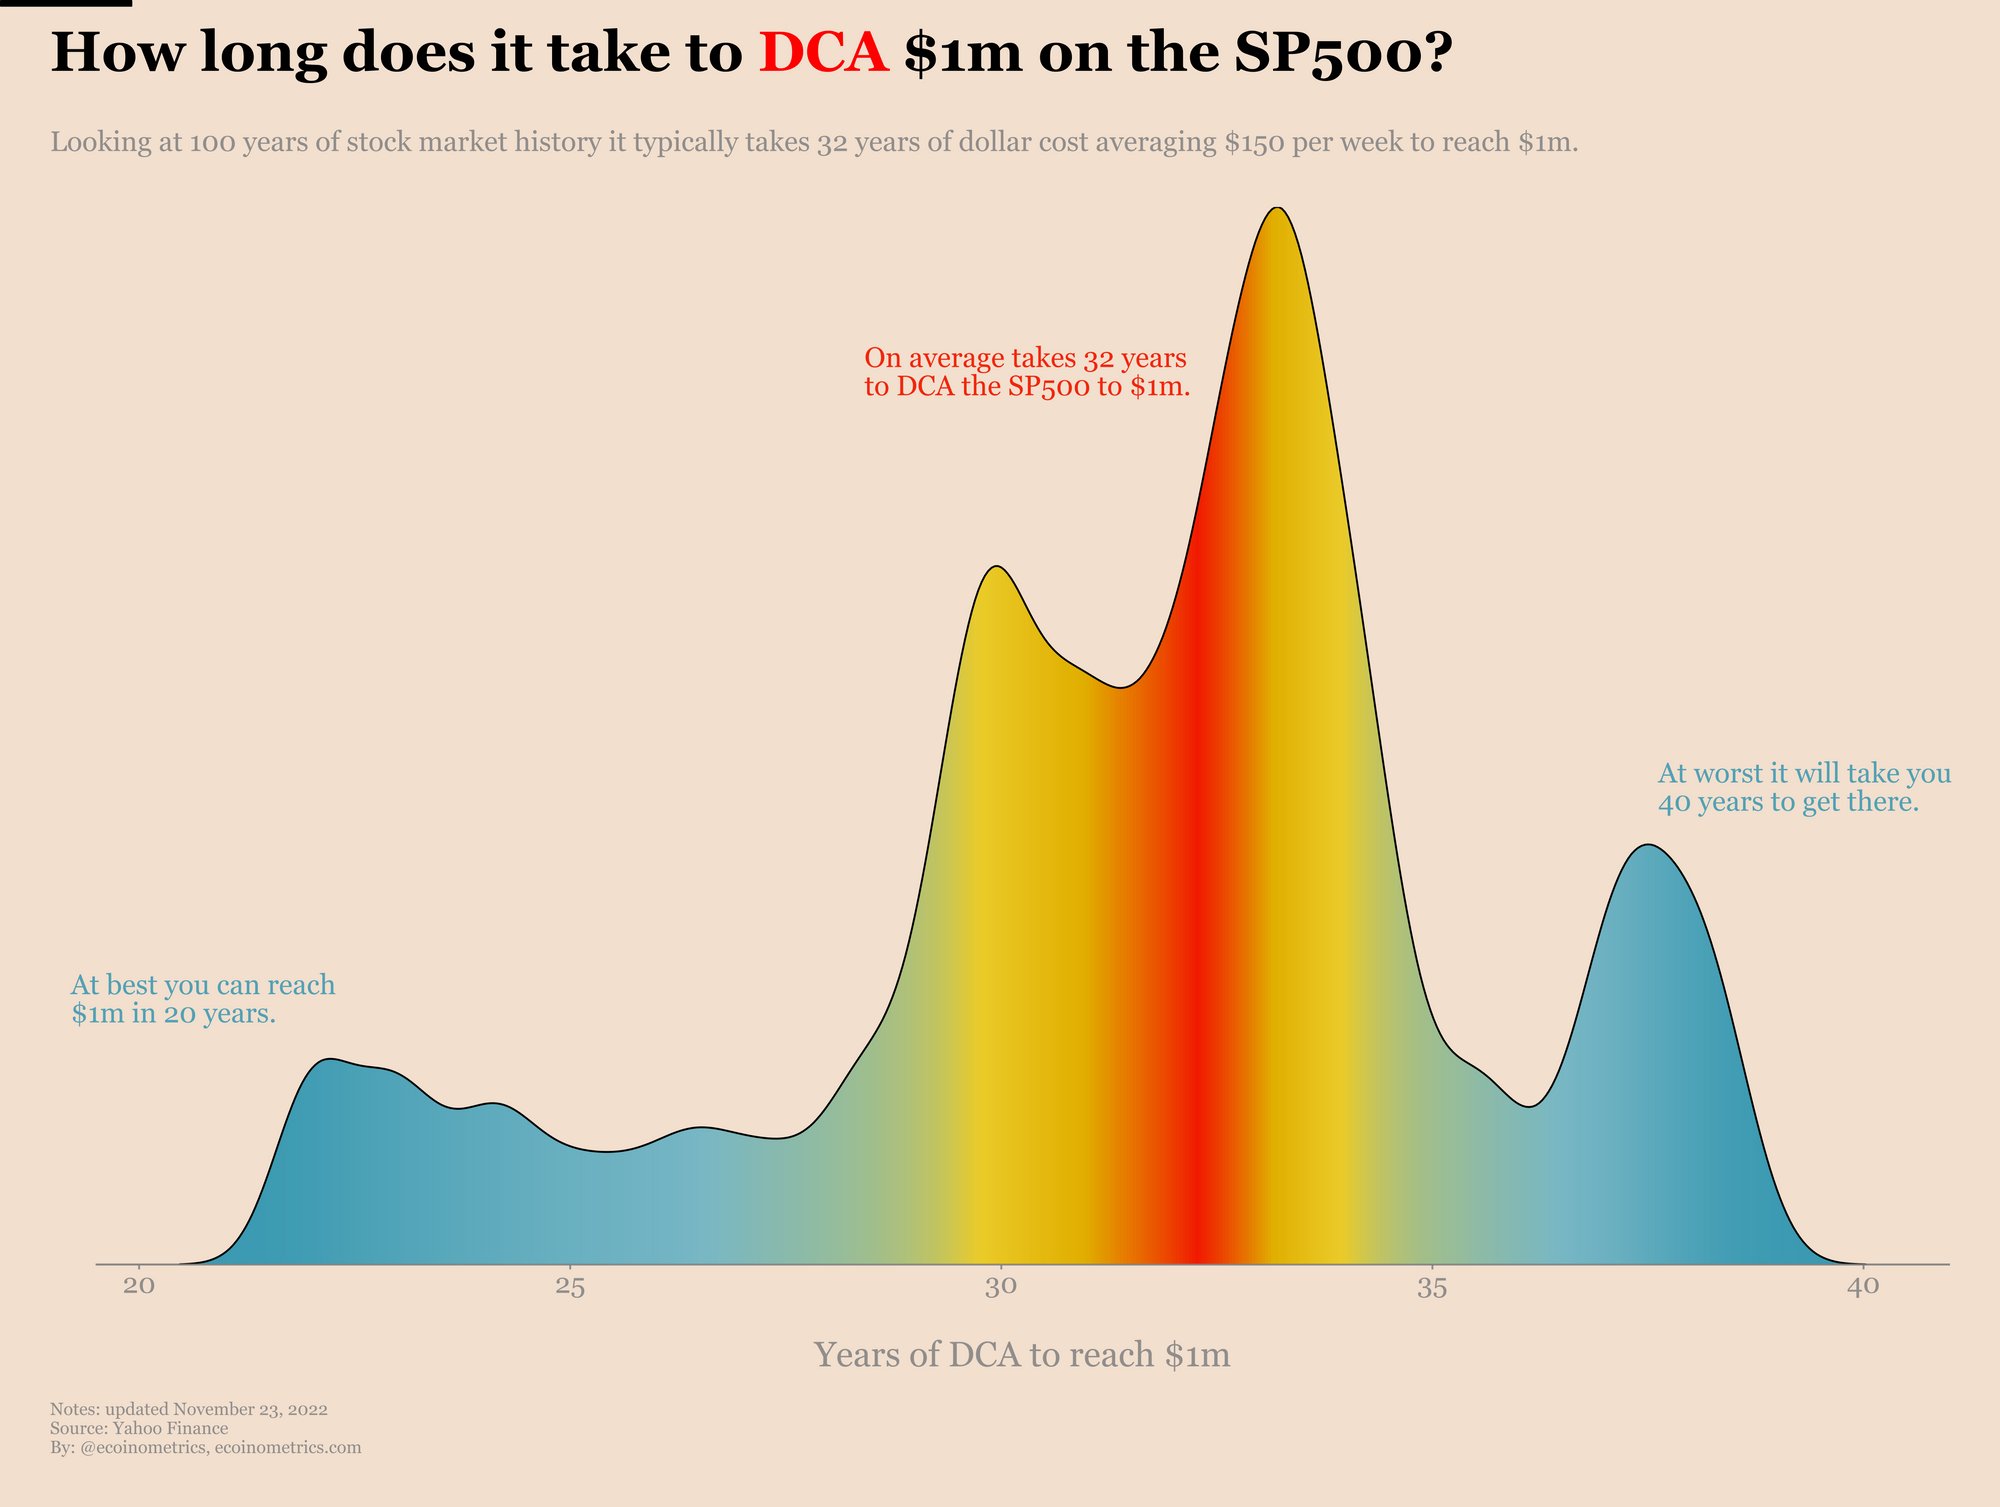
On average it takes 32 years to get to $1 million. At best it takes 20 years and at worst 40 years. So better start young if you ever want to try to achieve this goal. That or you need to significantly up the amount of dollars you invest every week.
To get $1 million in 32 years your total cost is roughly $250k which means your return on investment is 500%. If you take your total cost divided by the number of years this amounts to saving $7,800 per year for your dollar cost average investment. That is something most people can achieve over a life time of work.
But that’s for past periods. If you want to be able to estimate how long it will take you to accumulate $1 million by dollar cost averaging the stock market starting today, you’ll need to make some assumptions on future returns and run the numbers.
How long will it take you to dollar cost average the stock market to a million dollar
When it comes to estimate how long it will take you to dollar cost average a million dollar on the SP500 there are two parameters we can play on.
One is in your control, that’s how much money you plan on using to DCA the SP500 every week. Let's set this here.
The other is not in your control. It is the expected growth of the stock market in the future. We can summarize this parameter as the expected annualized return of the SP500 over the long term in the future. This one you can only estimate.
You don’t have to pick that number at random though. We can turn back to the 100 years of data with have for the SP500 and look at the distribution of those historical annualized returns (calculated on a rolling 5 years basis).
You can see that on the chart below. The orange line represents the median annualized return over the SP500.
Now is your turn again to make your assumptions about the future annualized returns of the SP500. You can tweak the expected annualized return in the box below, it will show up as the red line on the chart above.
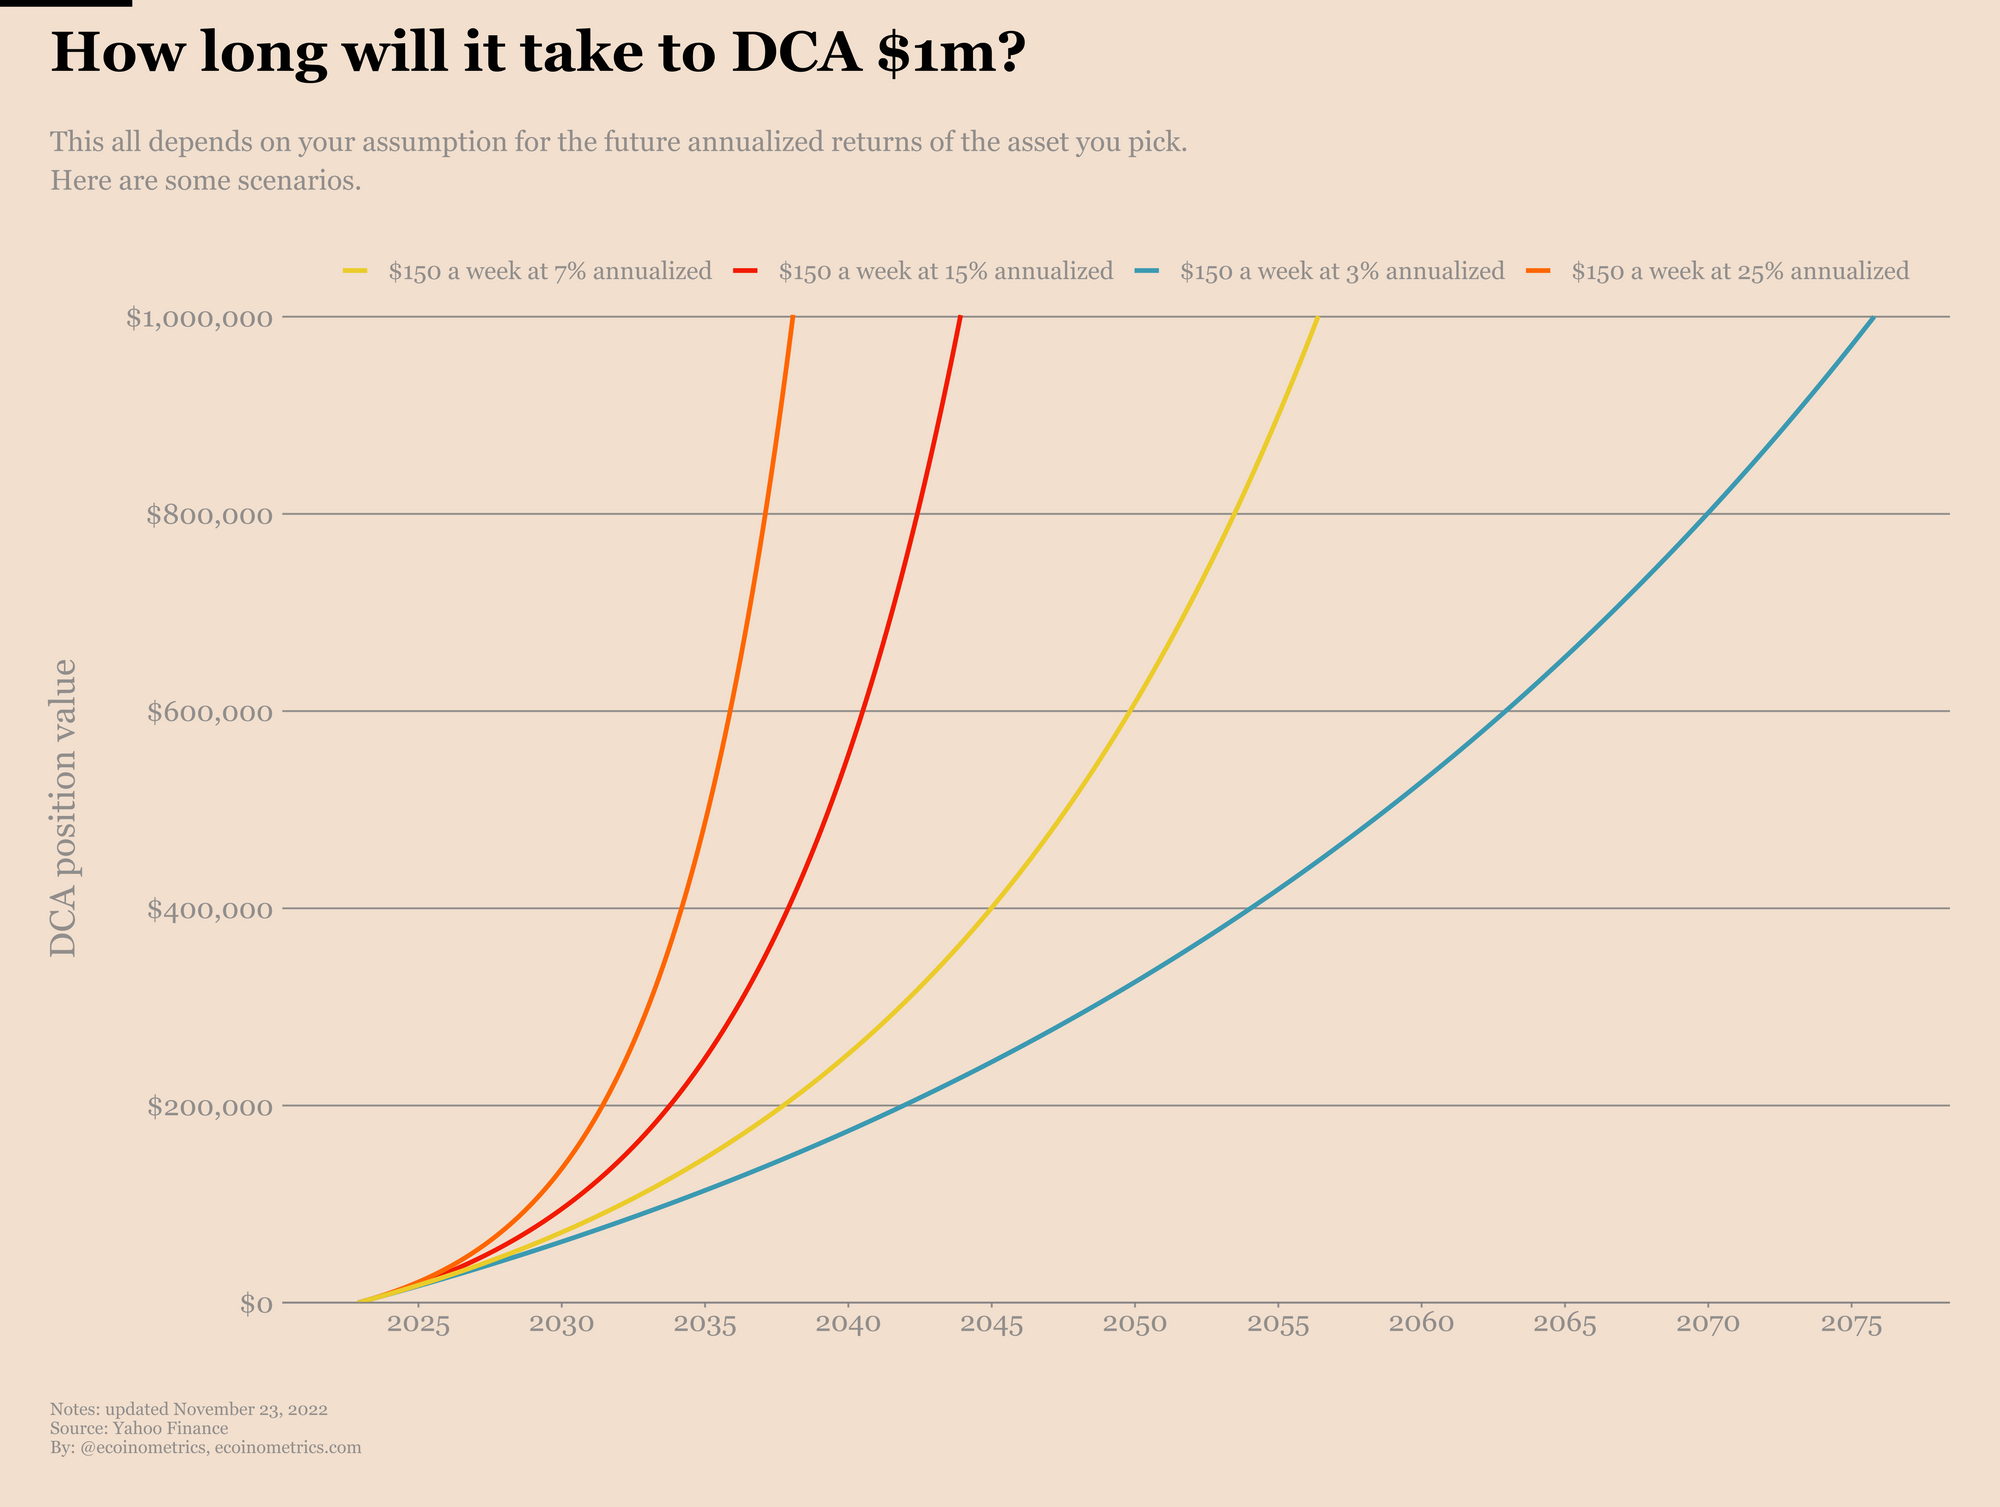
Based on this data we can compute how long it will take you to dollar cost average the SP500 up to $1 m. So here it is.
Here we’ve picked a few expected returns that are representative of different beliefs in the future:
- If you are very conservative 3% annualized is very reasonable. At this rate it will take you 50 years to get to $1m.
- If you want to go with a statistically reasonable assumption, 7% is the median. At this rate it will take you 30 years to get to $1m.
- If you are optimistic about the future then go with 15% annualized. At this rate it will take you 20 years to get to $1m.
- If you think the stock market is about to enter an unprecedented period of sustained growth then go with 25%. At this rate you’ll get to $1m in only 10 years.
So what’s the tl;dr? Yes you can go from $0 to $1m by dollar cost averaging the stock market. You can even do so by dollar cost averaging a relatively small weekly amount. But this is a get rich slow scheme. With some reasonable assumptions about the returns the stock market can deliver in the future it will likely take you 30 years to get there.
The moral of the story is that you compounding works but it takes time. The earlier you make an initial investment the better.
If you are looking for a faster way to compound your savings then dollar cost averaging Bitcoin could be a good option. But if you are not in a rush and want to know that you'll eventually achieve your goal with a high level of certainty then sticking to the stock market isn't a bad idea.
We have other dollar-cost averaging calculators in the works, notably a dollar cost average calculator for Bitcoin and another one for Ethereum. Ready soon.
Ecoinometrics
At Ecoinometrics we help you navigate the landscape of digital assets and macro economics with investment strategies backed by data. Enter your email below to receive our weekly newsletter directly in your inbox.
On top of the regular posts accessible to everyone, paid subscribers get access to:
- All the newsletters (2 every week) and the entire back catalogue.
- All the interactive dashboards, including our Bitcoin on-chain accumulation tracker.
- All the community features including suggestions of charts and research topics.
This is all you need to make strategic investment decisions backed by data.
If you want to know more about it head over here www.ecoinometrics.substack.com.