Is the US in a recession? That depends on whom you ask and what measure they use
There are two kinds of economic indicators: those that are forward looking and those that are lagging. The economists working at the Federal Reserve or in governmental institutions typically only care about the lagging metrics.
That's why you often see a big discrepancy between the actual economic situation and what the discourse of the official economists.
So far the forward looking indicators such as the inversion of the yield curve or the momentum of the PPI are signalling that the US is going into a recession. Not only that but the global economy is entering a period of economic contraction.
Still, the question is, are we already in an official recession?
To figure this out let's have a look at what the data says by comparing the current economic situation to past recession.
Subscribe to the Ecoinometrics newsletter if you want help to navigate the landscape of digital assets and macroeconomics with investment strategies backed by data.
How do we define a recession?
The general definition of a recession is a period of decline in the economic activity of a country.
But you and I can’t just declare the US in recession. This is a job left to professional economists.
In the US the National Bureau of Economic Research (more specifically the NBER committee) is the institution in charge of officially declaring when a recession starts and end.
The criterion for a recession are a bit more specific than the definition we gave earlier. To get a recession you need:
- A significant decline in activity spread across the economy.
- This decline must last more than a few months.
- This decline must be visible in the real GDP, real income, employment, industrial production and wholesale-retail sales metrics.
So let’s look at those metrics to figure out whether or not the US is already in a recession.
Inspecting individual recession indicators
We are looking for a significant decline in economic activity lasting more than a few months. Let’s try to clarify what that means.
Economists like to work at the scale of a quarter, so typically a few months refers to more than 3 months.
The term significant decline is more vague. But the rule of thumb is that you should be able to notice a significant decline when you see one. We’ll make that more specific when we look at historical data below.
What we expect during a recession is:
- The real GDP to fall down as the economic activity is declining.
- The unemployment rate to climb up as people are laid off.
- The industrial production to fall as there is less consumer demand to serve.
- The retail sales to fall as consumers stop spending.
- The real personal income to stagnate or decline as people lose their jobs and investments produce less returns.
That’s for the expectations. But what does the data shows in practice? Let’s go through those recession metrics one by one.
Real GDP during a recession
What is the real GDP? The Gross Domestic Product is the total output of the US economy expressed in US$. It aggregates the total value of the goods and services produced in the US. The real Gross Domestic Product is simply the GDP adjusted for inflation.
If you think about it, the real GDP is a more fair measure of economic output. Because if everything is more expensive, if the currency you are using is losing its purchasing power, the GDP itself will grow. But that doesn’t mean you are producing more things. It just means you have marked up the price of everything to produce a bigger number. When you adjust for inflation, you don’t have this problem.
Doing so is especially important during periods of high inflation where all assets typically struggle to keep up.
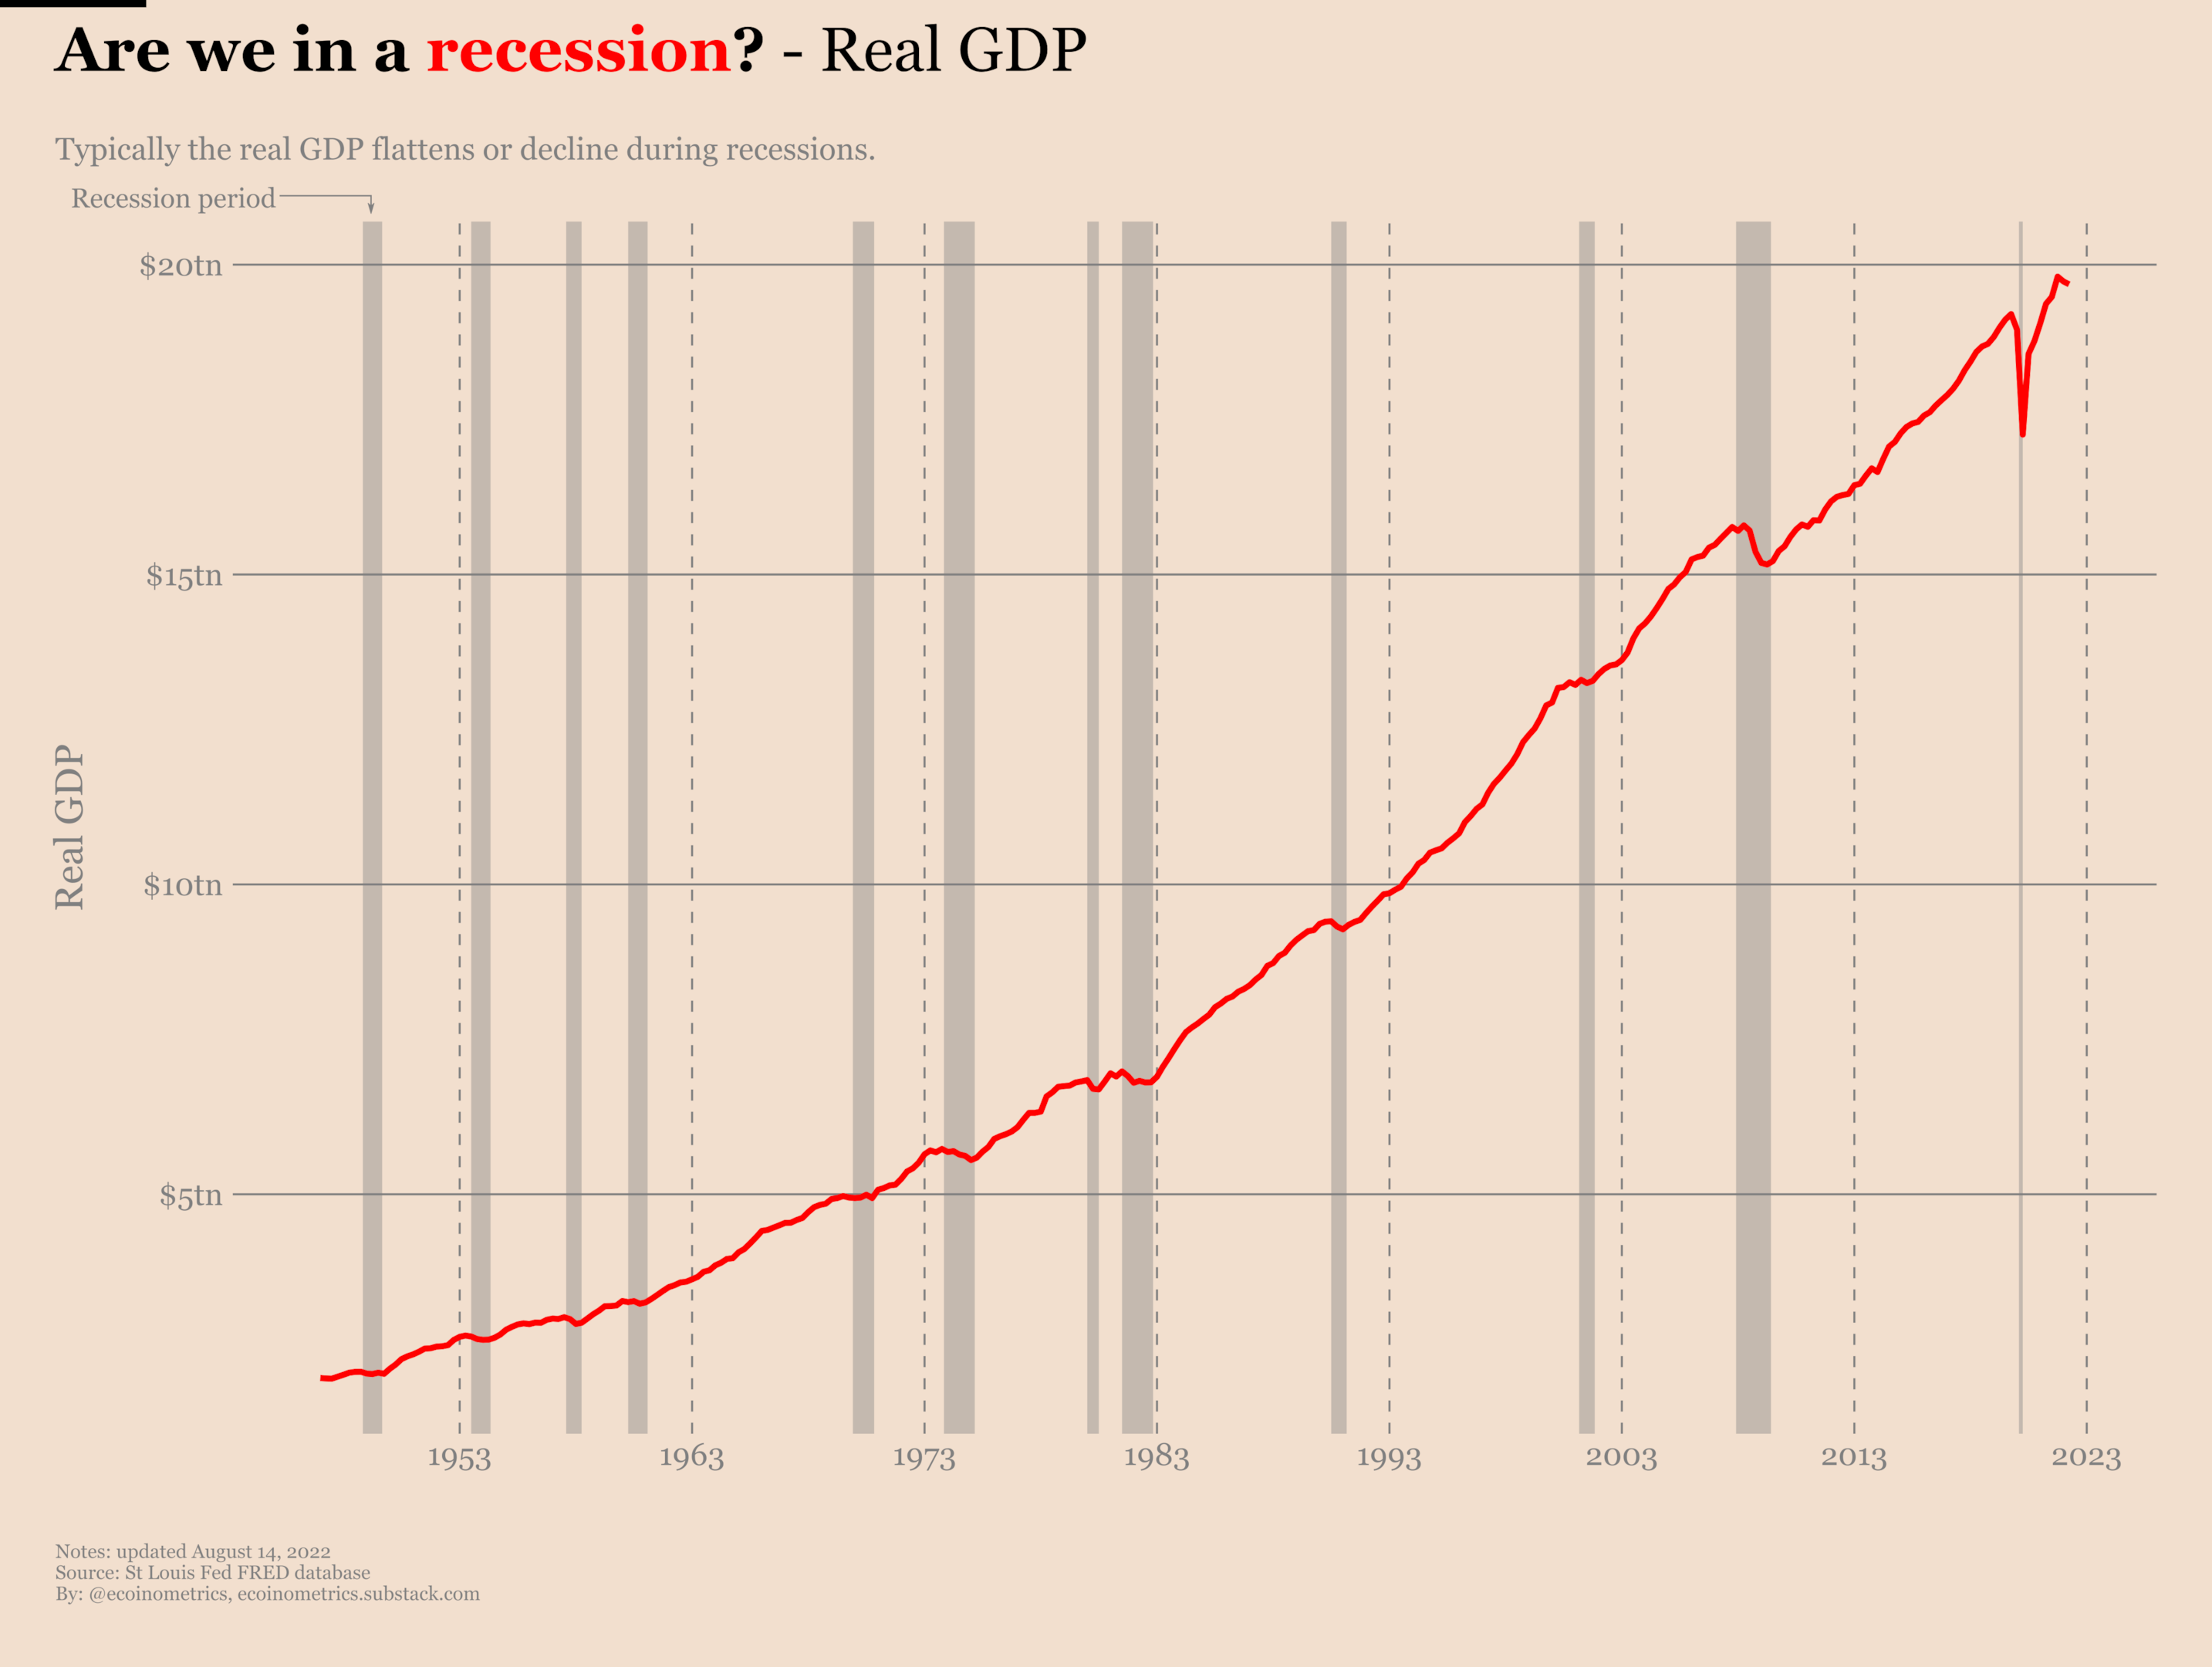
So let’s have a look at the evolution of the real GDP. On the vertical axis you can read the GDP of the US adjusted for inflation. The grey bands represent the periods of official recessions according the National Bureau of Economic Research. As you can see the real GDP typically flattens or decline during recessions.
We can make this fact more obvious by changing perspective. Instead of looking at the evolution of the real GDP we can look at the change in real GDP during each recession.
Each line in the chart below represents the trajectory of the real GDP during a recession period. We have highlighted the Great Recession of 2008, the recession that followed the Dotcom bubble and the current economic situation for comparison.
As you can see the real GDP tends to trend down during a recession. Moreover, the real GDP is currently down for the past two quarters. That means as far as this metric is concerned, we could be in a recession.
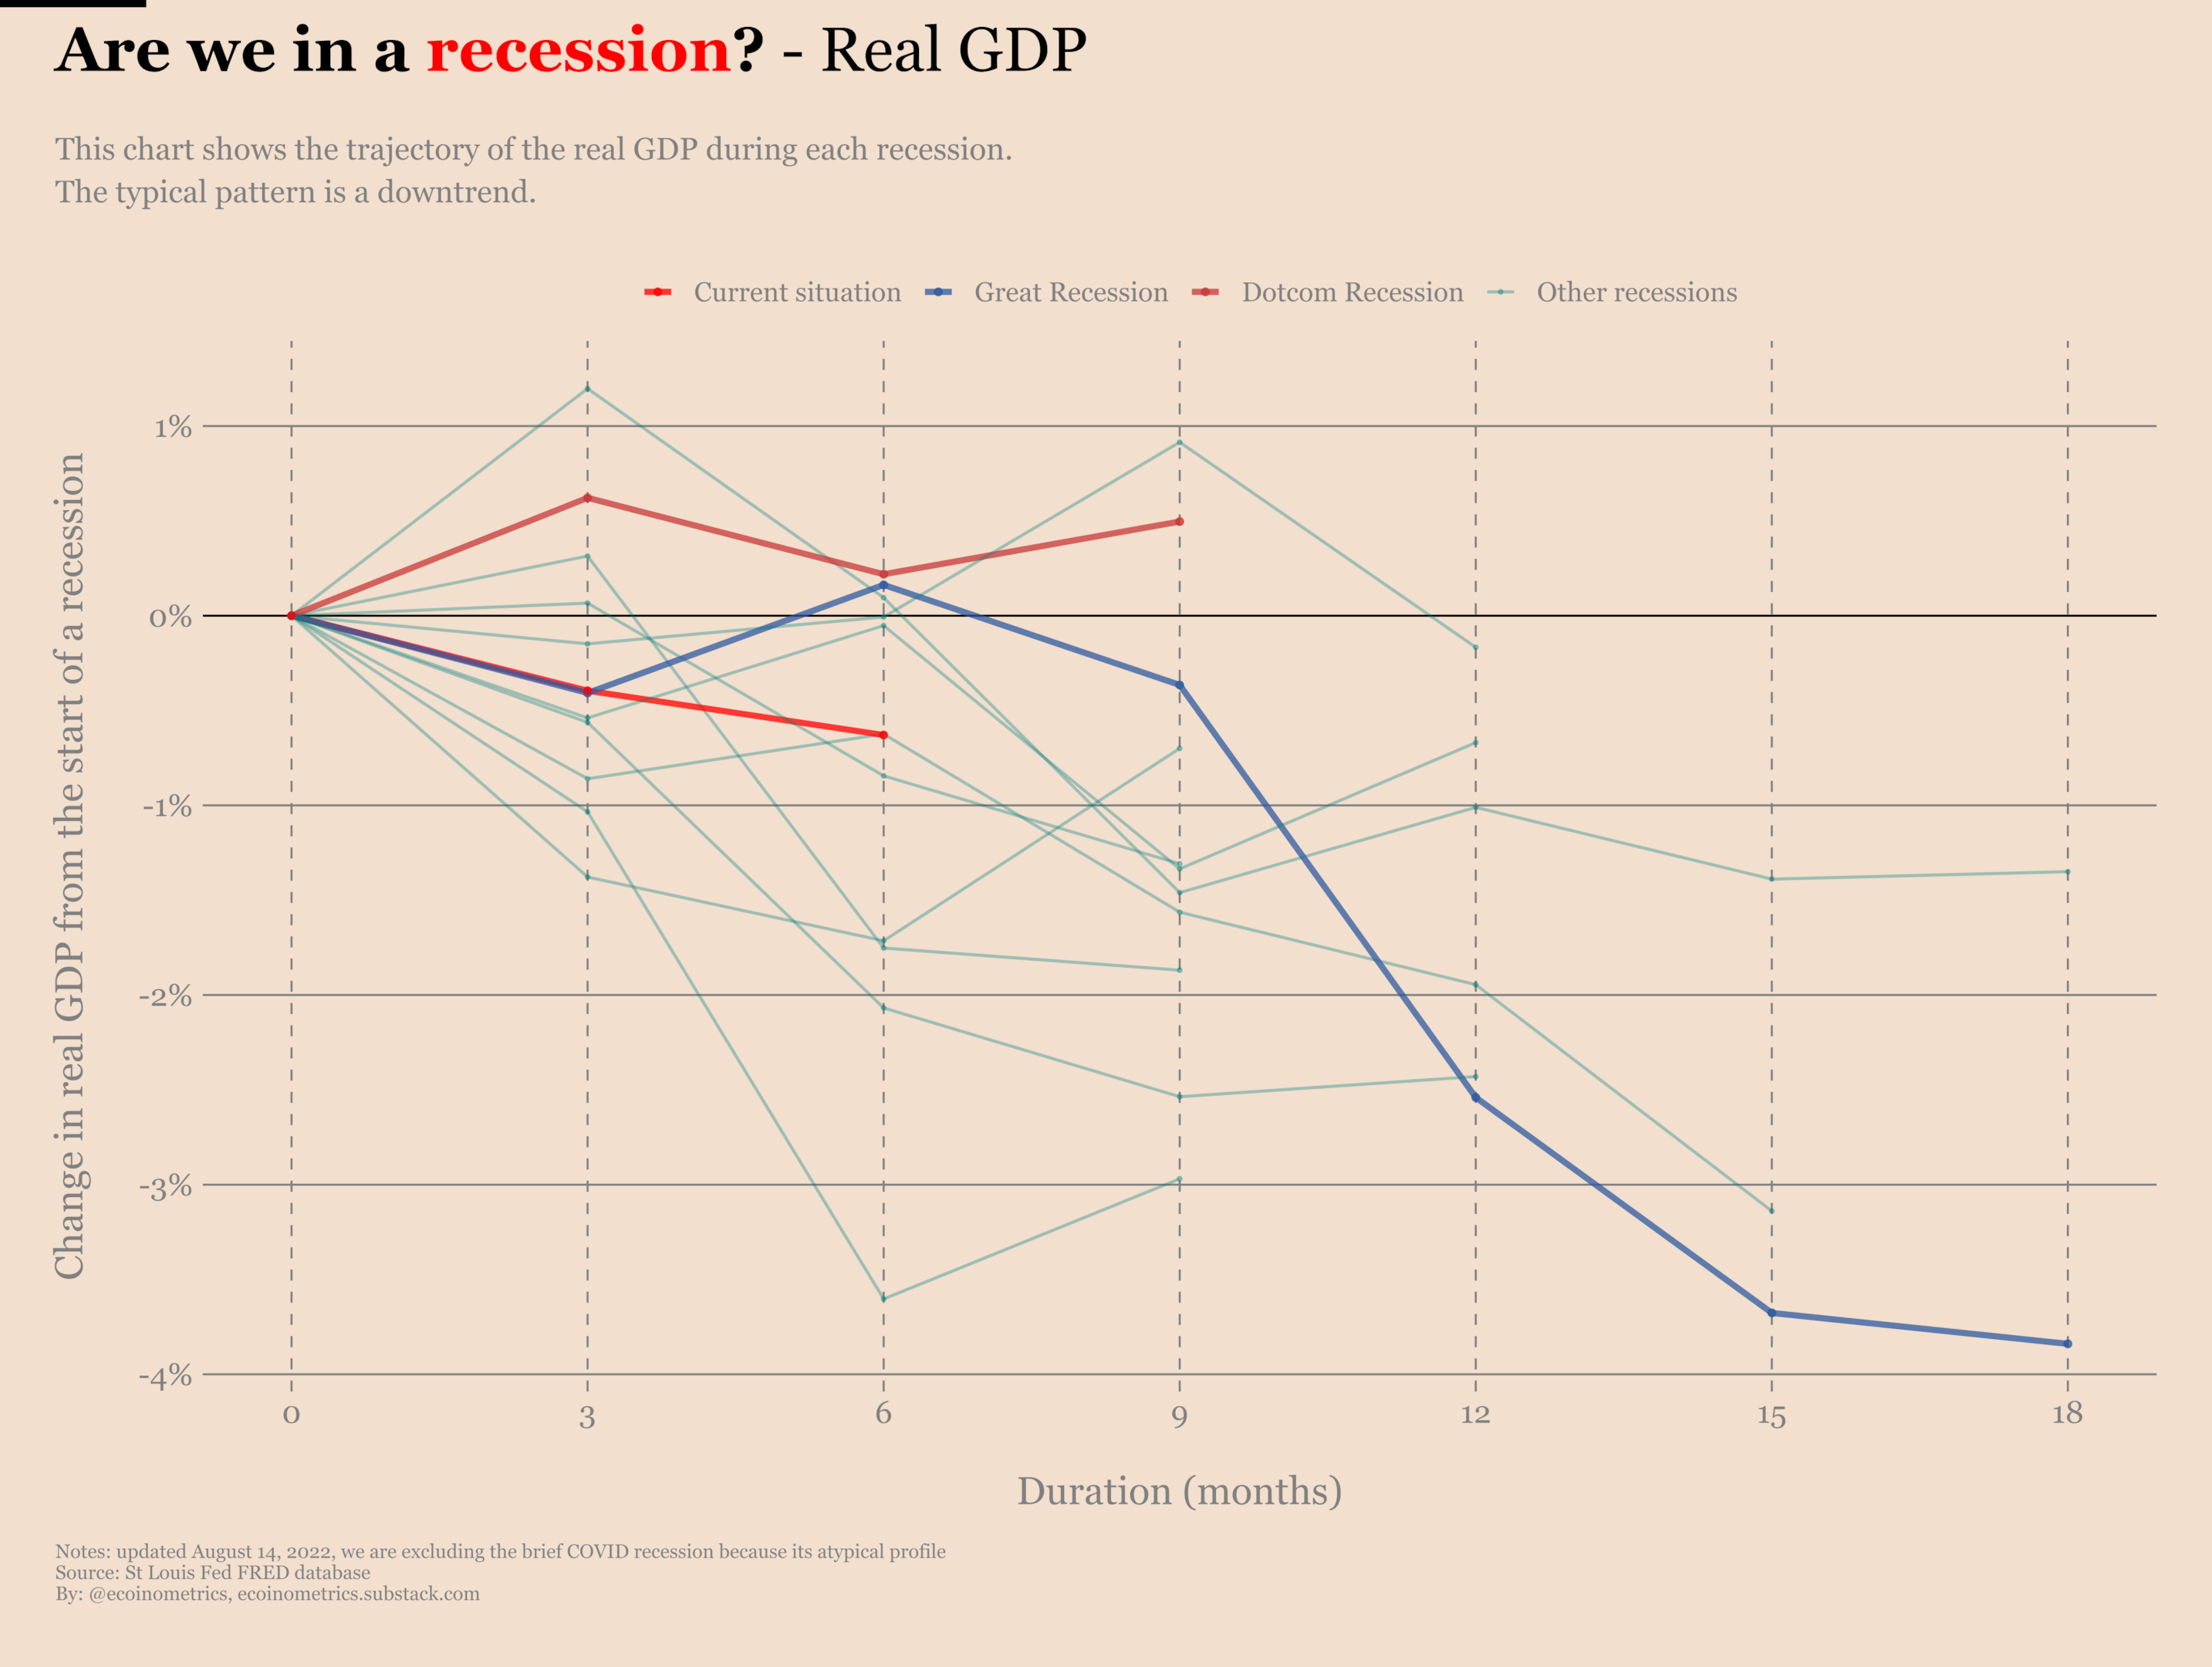
Note that we excluded the COVID recession of March 2020 from the latter chart as its profile is very atypical and does not inform us much about the current situation.
Unemployment rates during a recession
The labor force consists of all the US residents aged over 16 who are not institutionalized or part of the Armed Forces. The unemployment rate is the percentage of the labor force that is unemployed.
Even more than a fall in the real GDP, a sharp rise in the unemployment rate is a very strong signal that the economy has entered a recession.
Take a look at the chart below. On the vertical axis you can read the unemployment rate. The official recession periods are represented by the grey bands. The pattern is striking.
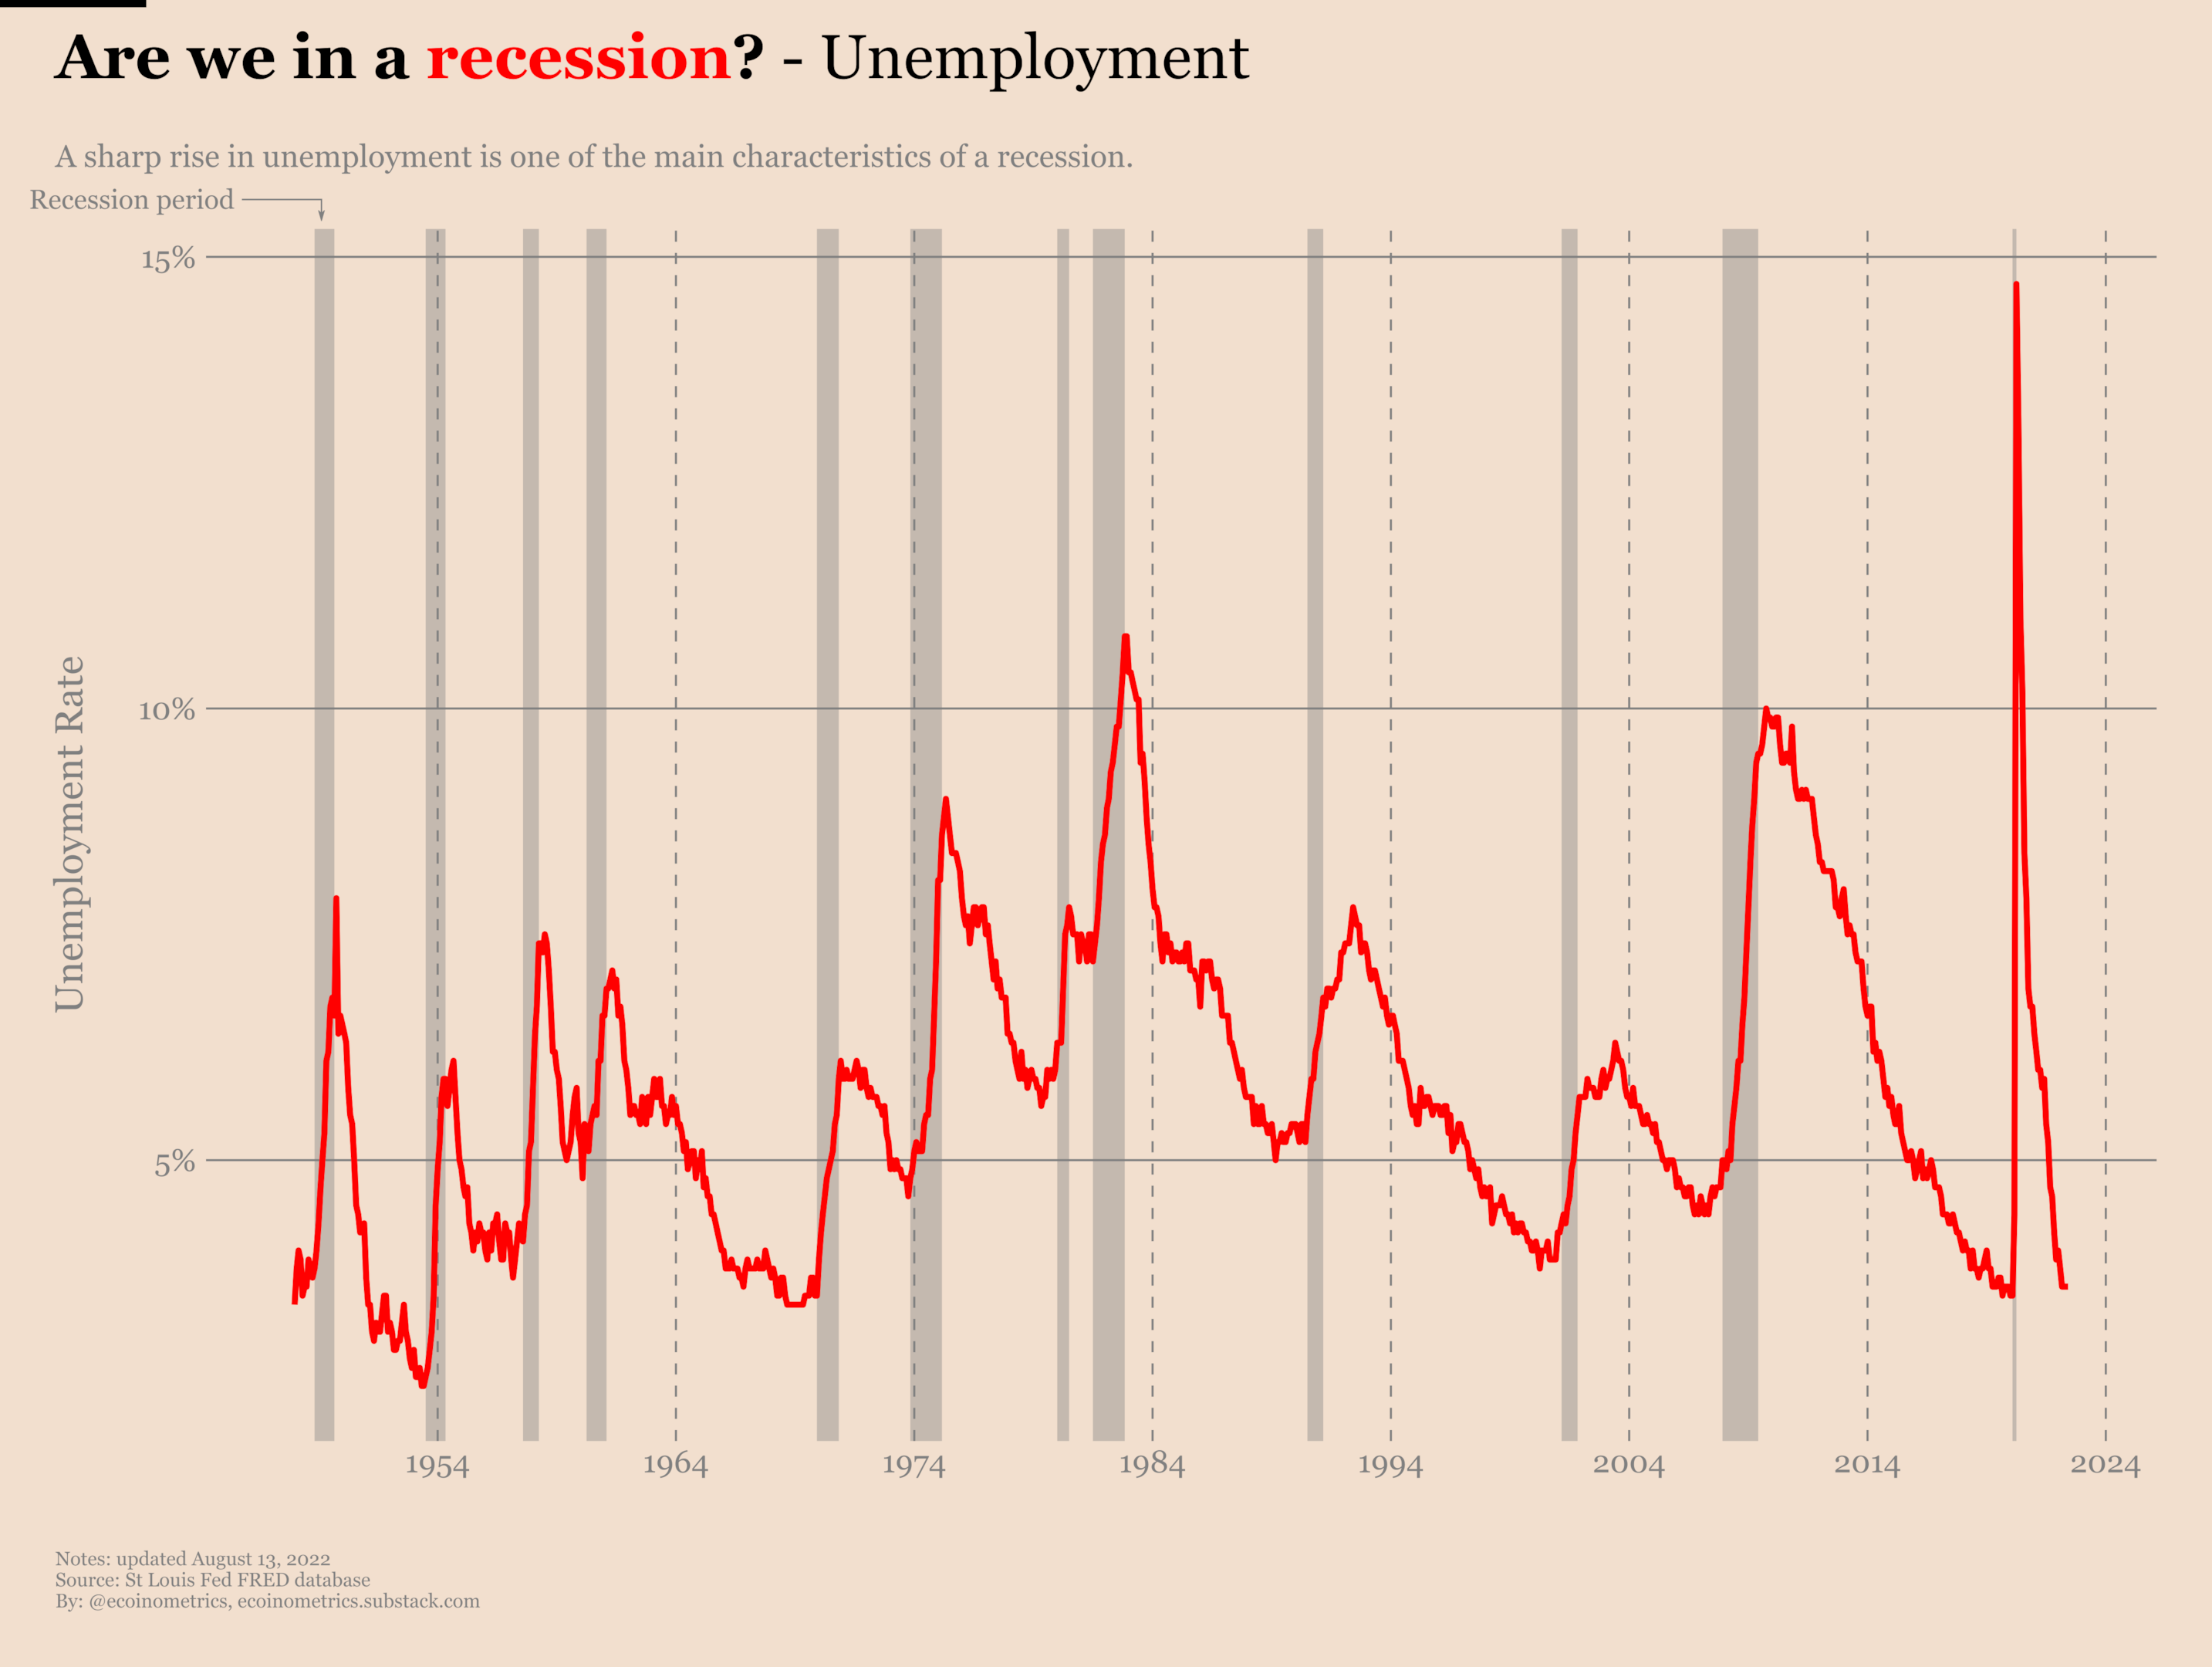
The labor market suffers more than anything else during a recession.
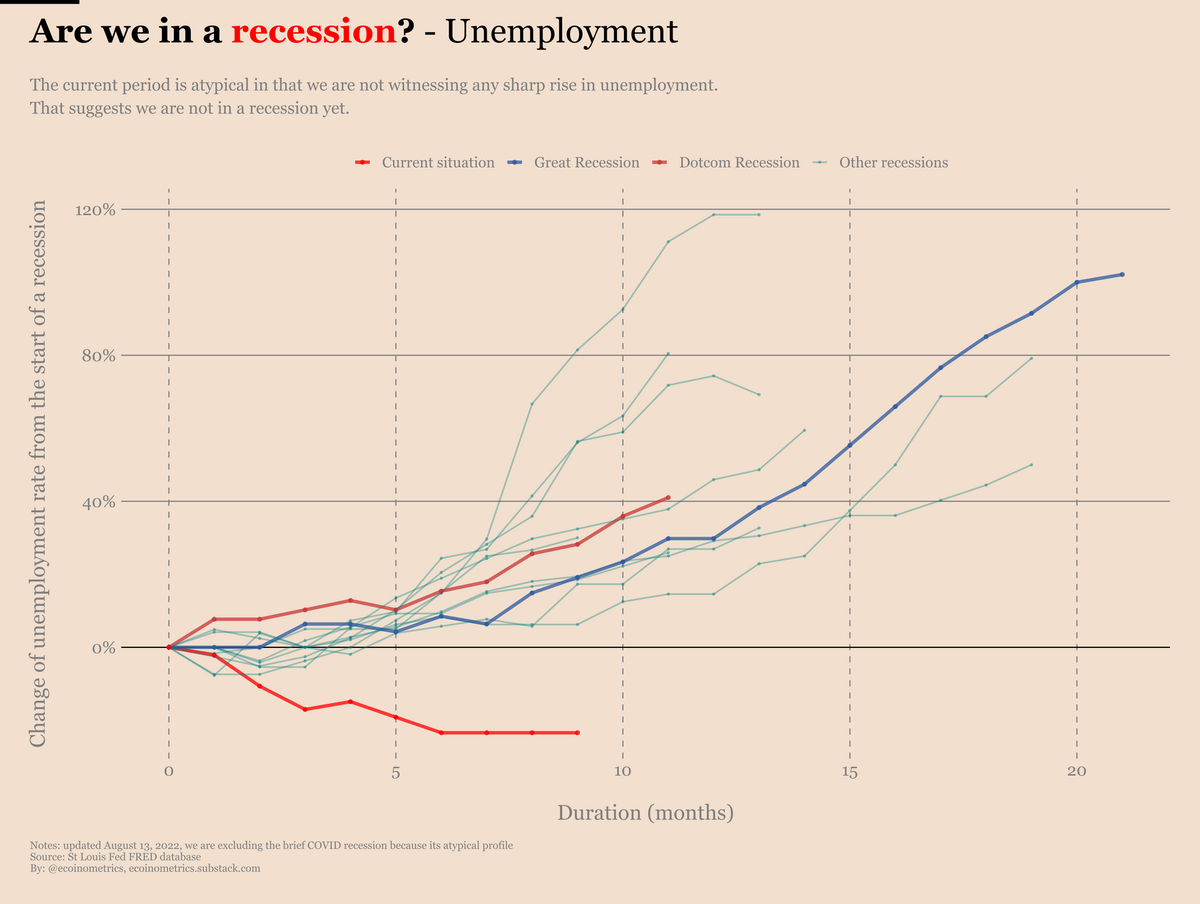
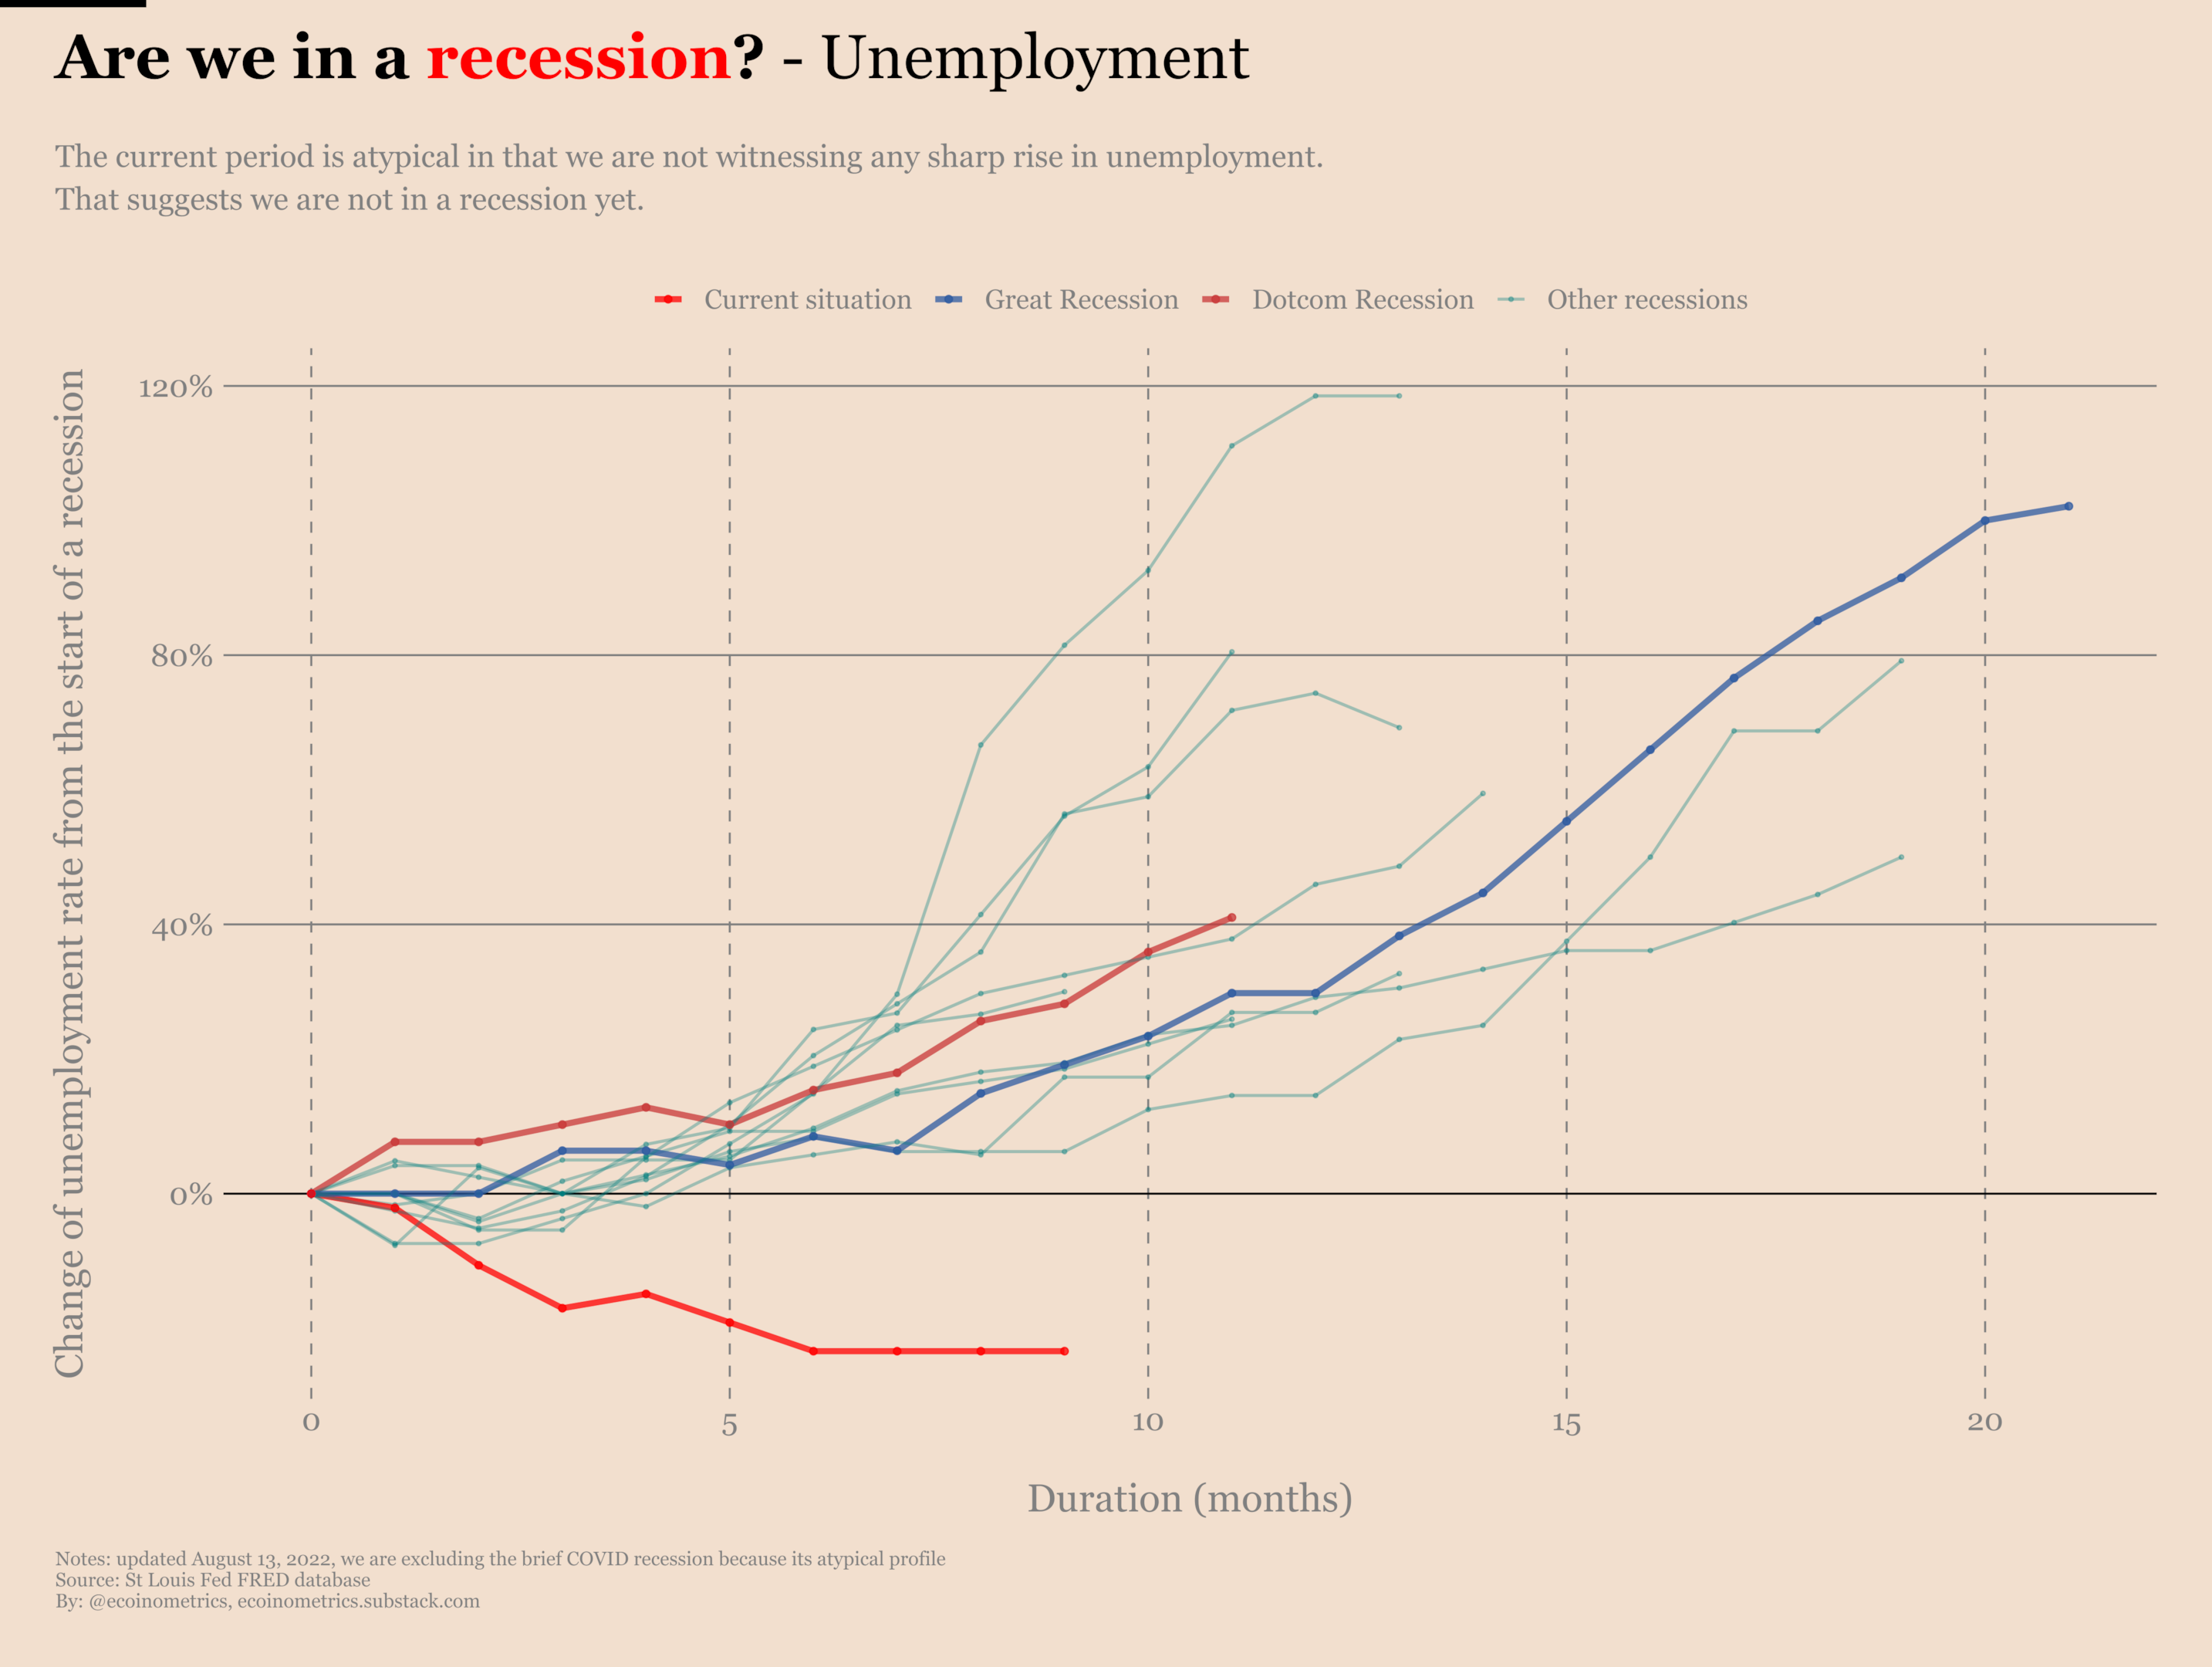
Changing our perspective to look at the change in the unemployment rate during the recessions makes this pattern even more obvious. Recessions invariably come with a strong rise of unemployment.
However the current situation shows that the unemployment rate has gone down and is now stable. So by that metric the US has a strong labor market and is not yet in a recession.
Industrial production output during a recession
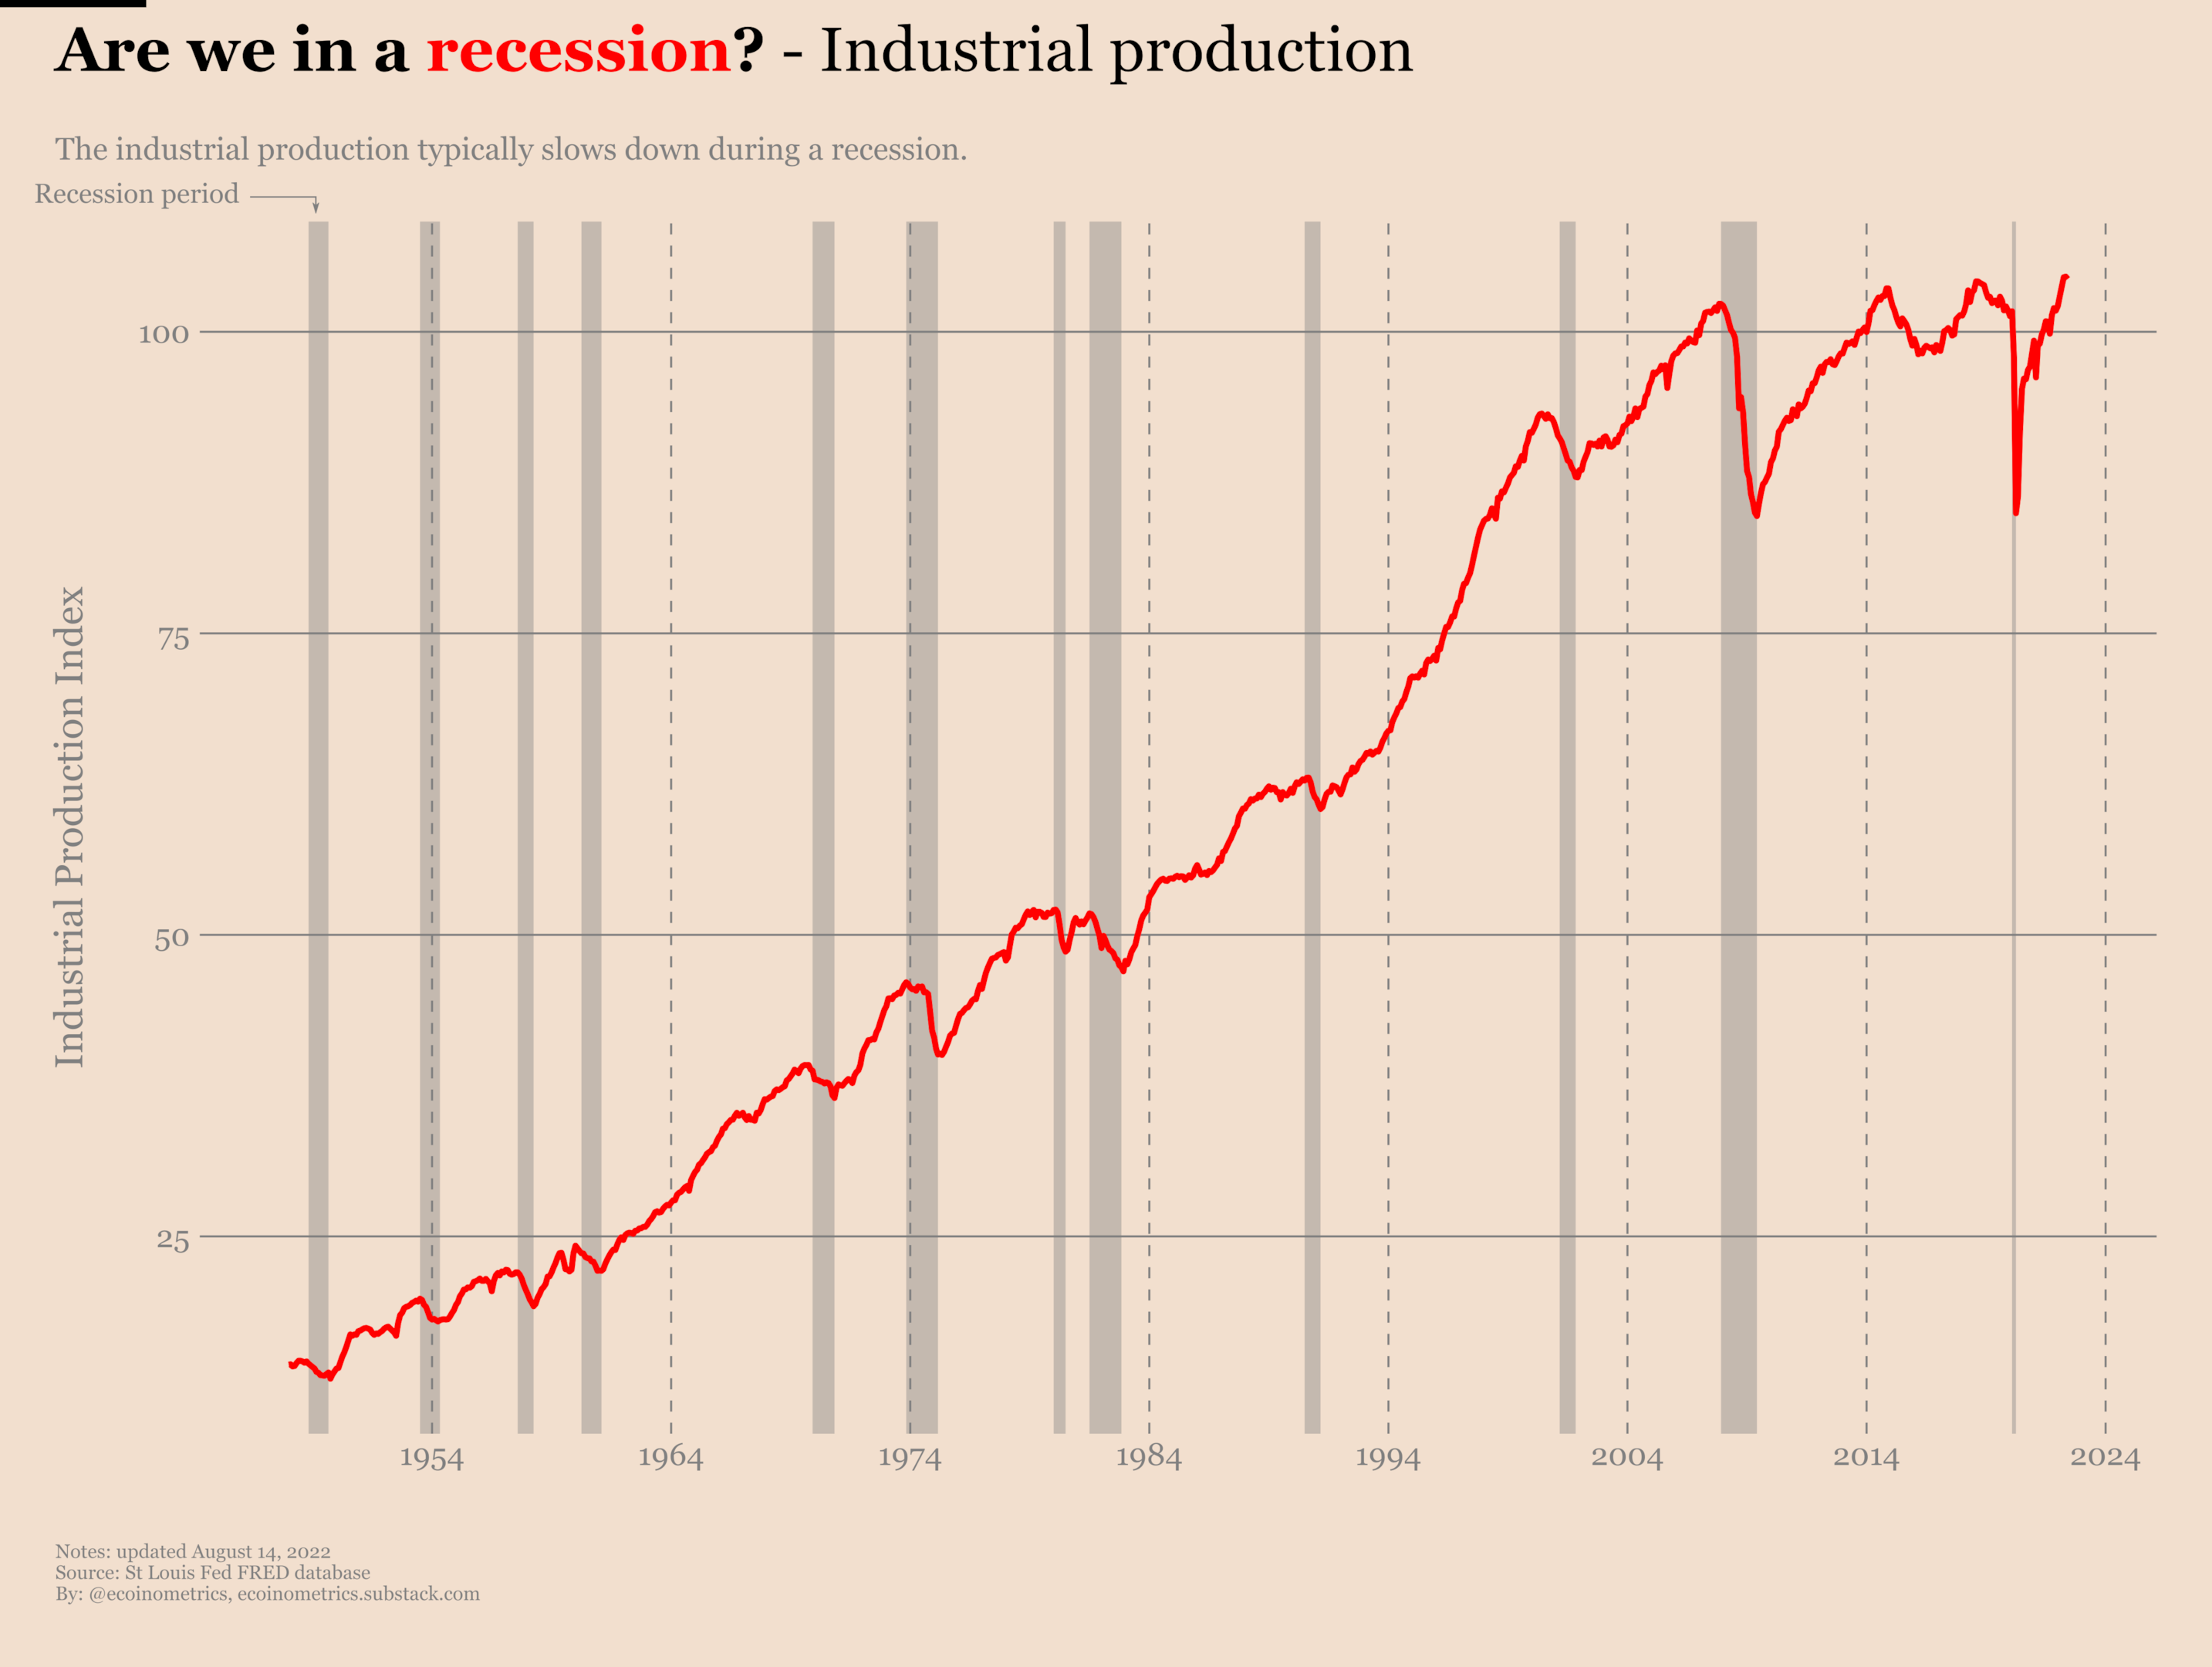
The industrial production output measures the total output from US manufacturing, mining and energy facilities. This industrial production output is represented by an index whose reference value was set to be 100 in 2017.
As you might expect the industrial production typically slows down during a recession. Take a look. On the vertical axis you can read the industrial production index. The official recession periods are represented by the grey bands.
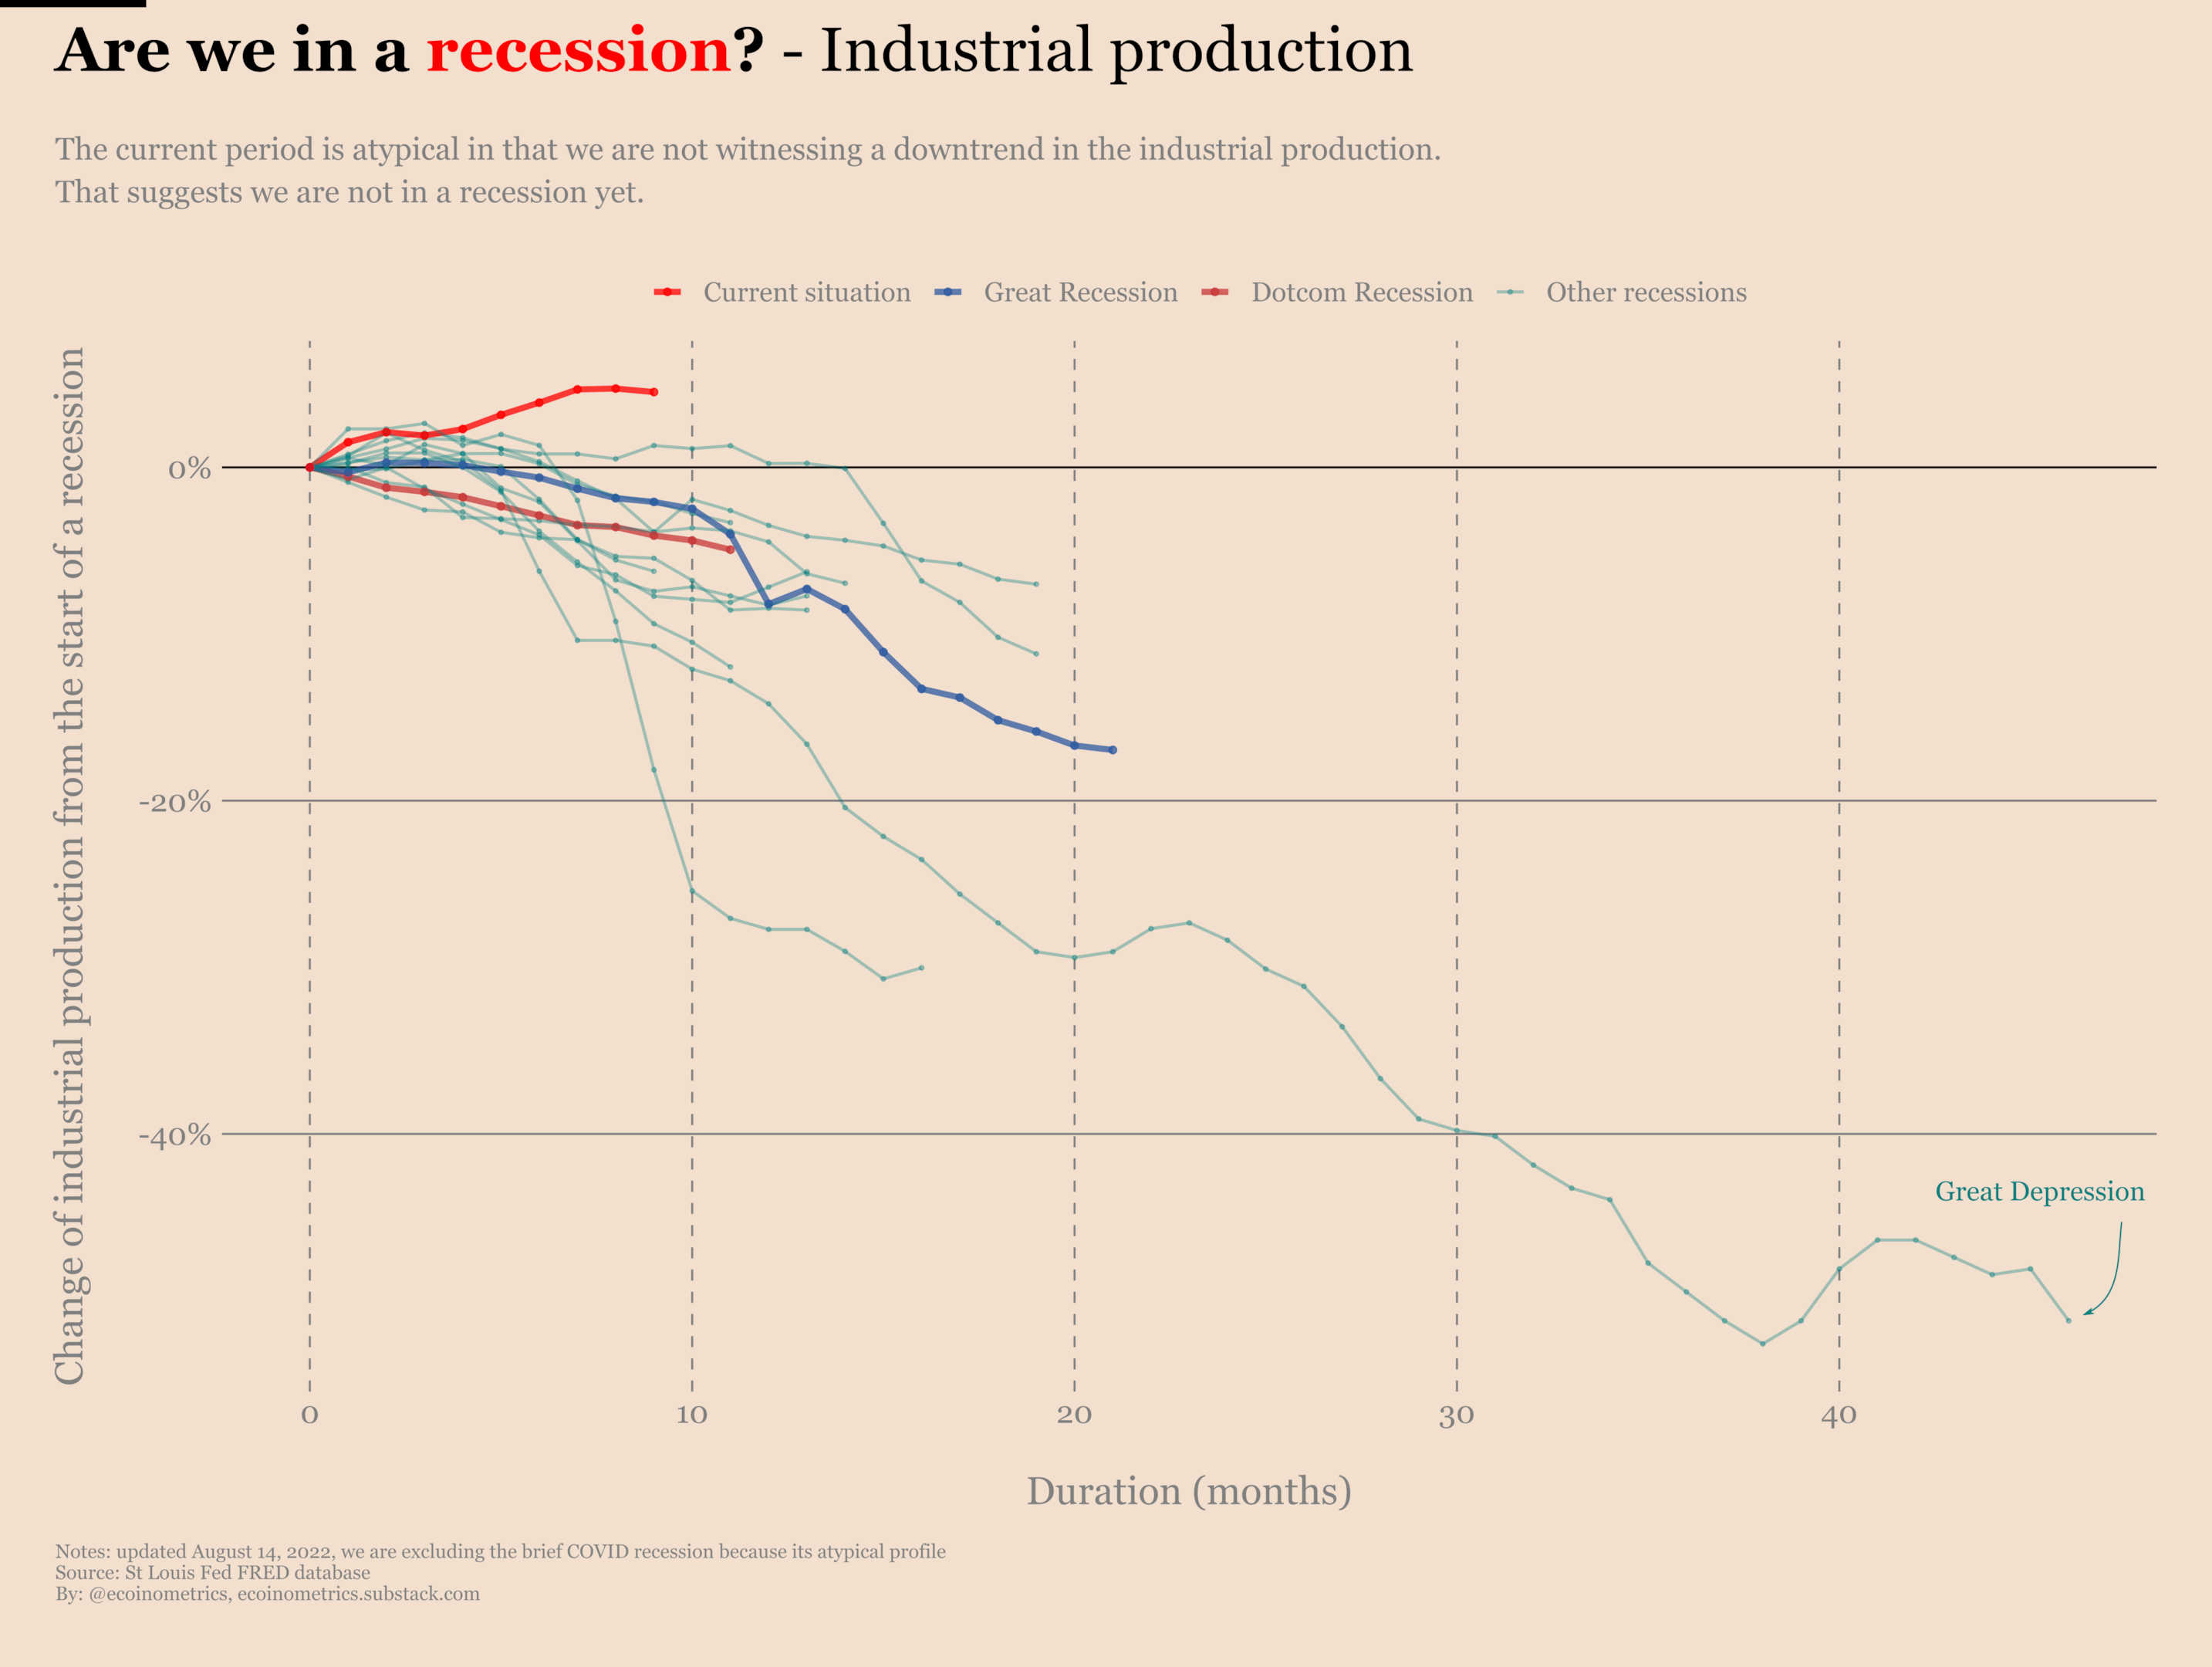
Switching to looking at the trajectories of the industrial output during past recessions you can see that the decline always happens. Even during the recession that followed the Dotcom bubble the industrial output suffered.
But that’s not something we are seeing in the current situation. Right now the industrial production is still rising. That would suggest we are not yet in a recession.
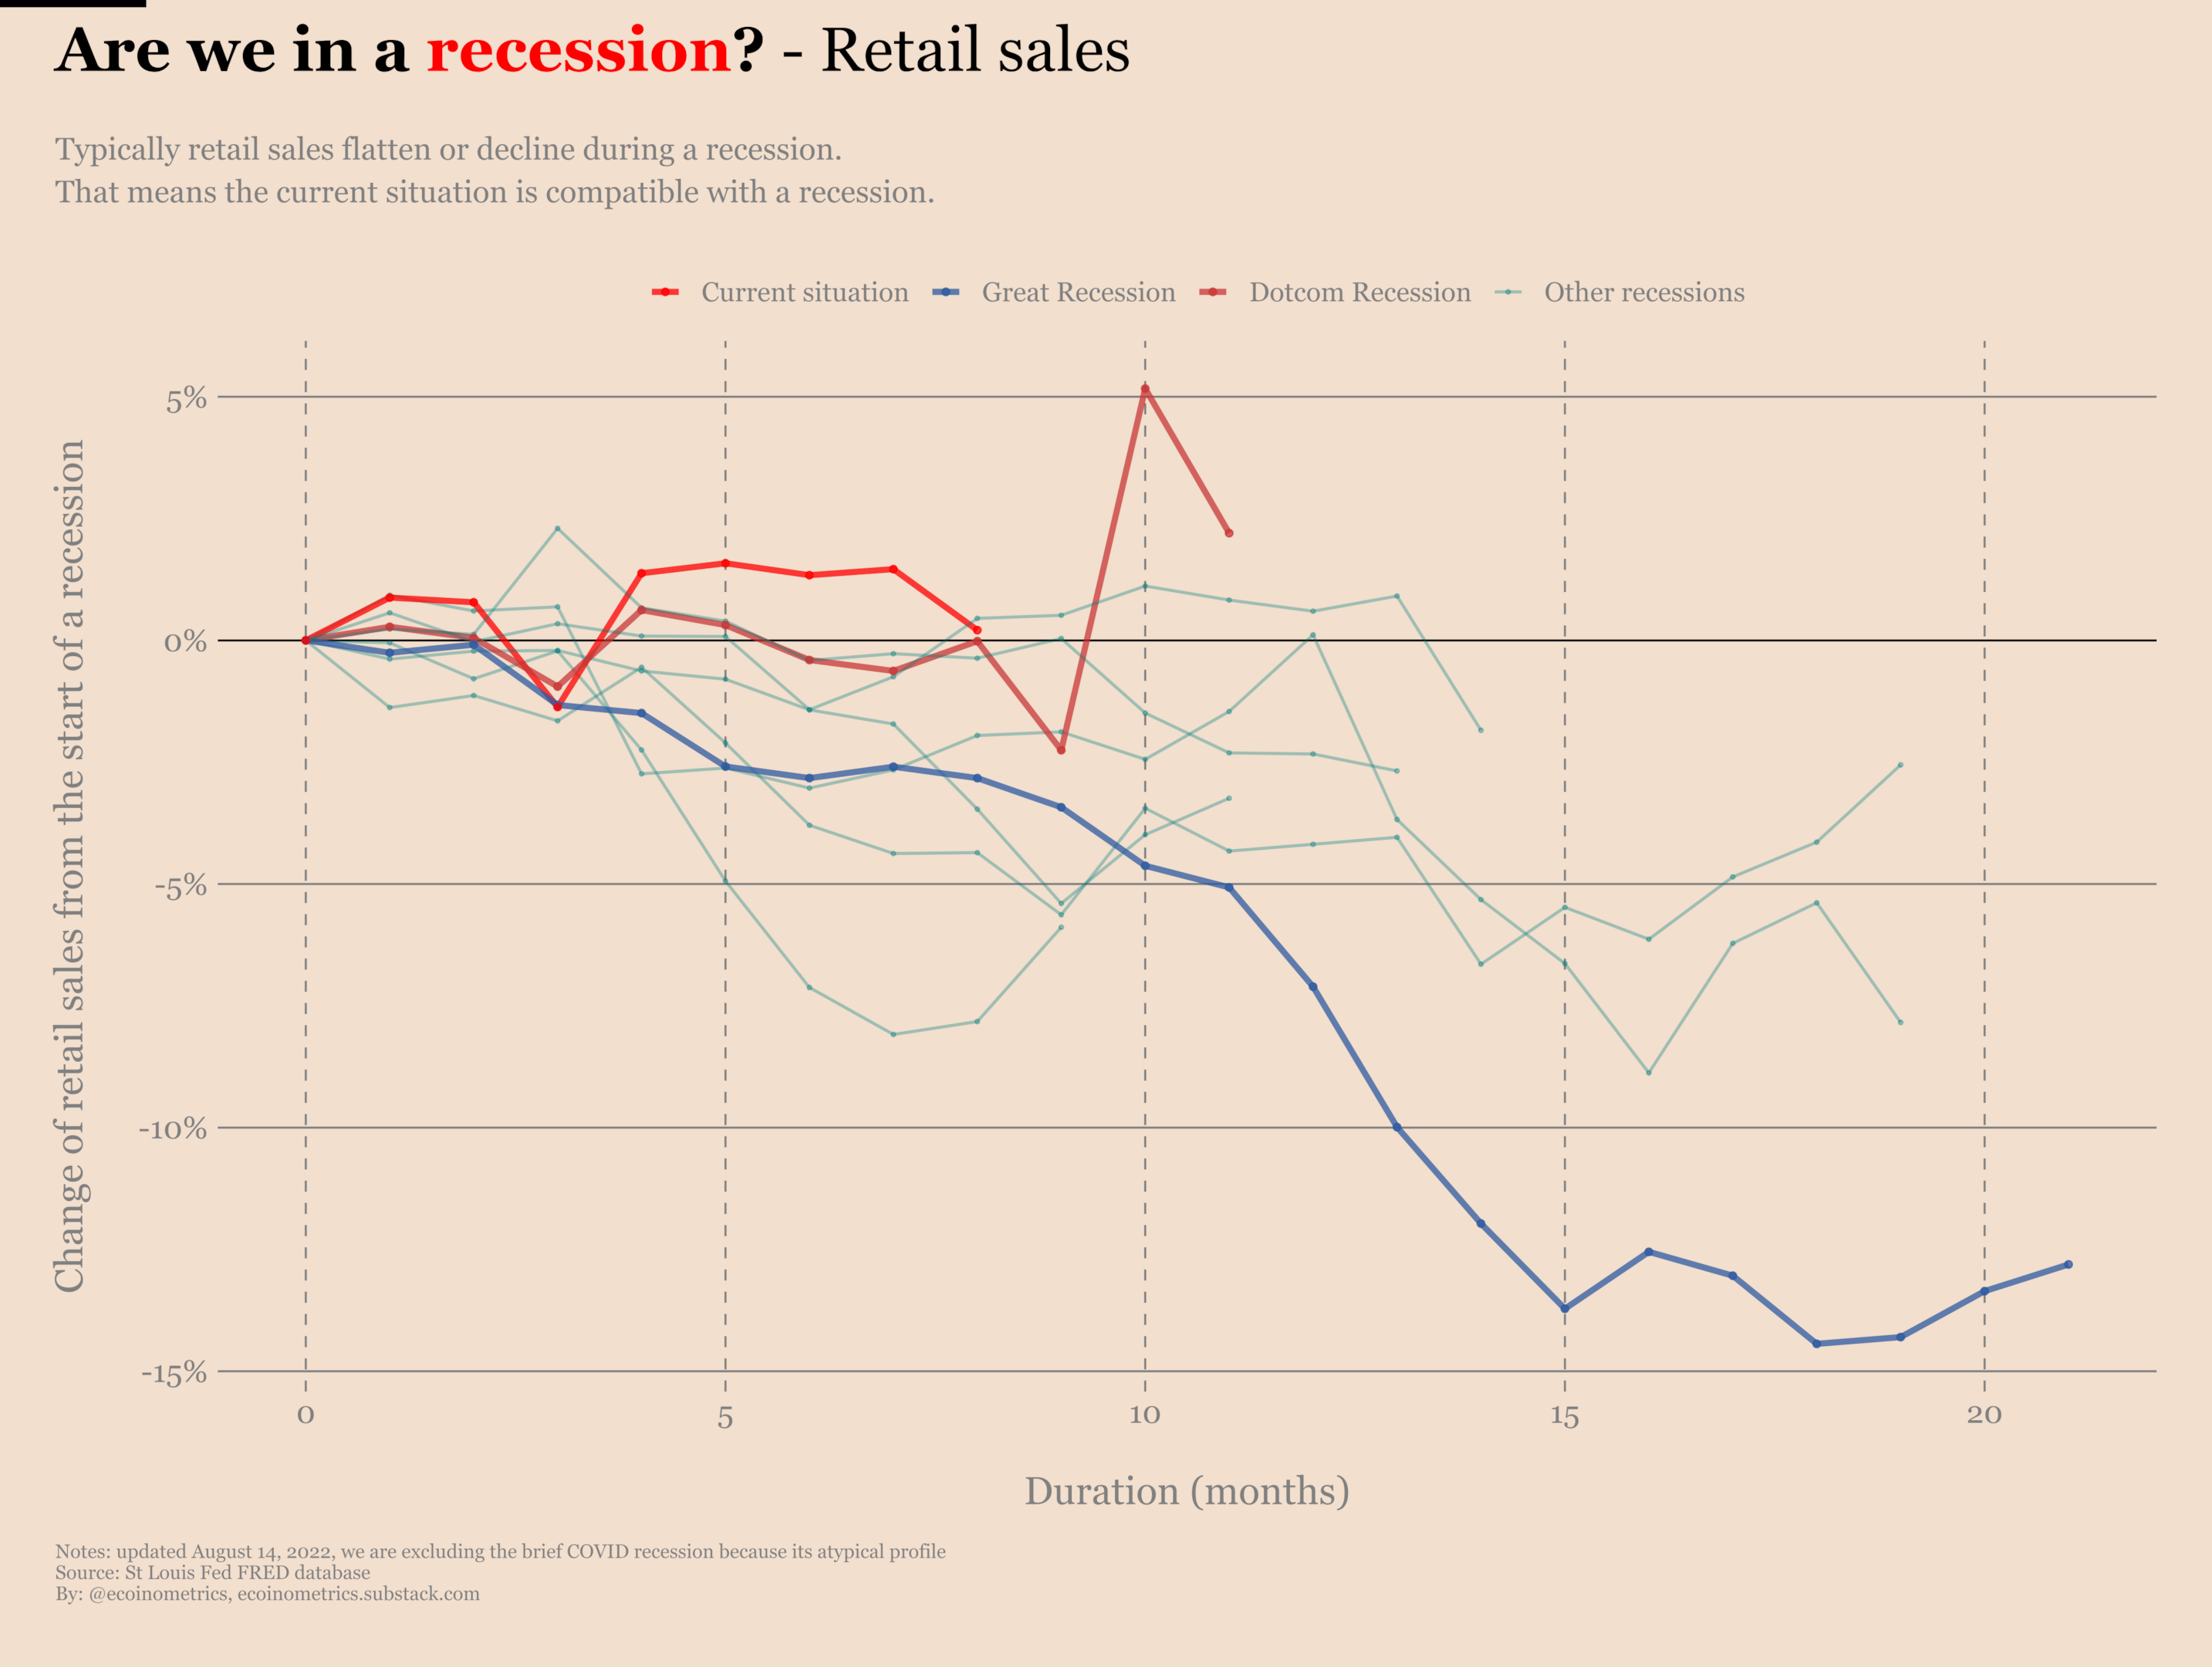
Retail sales during a recession
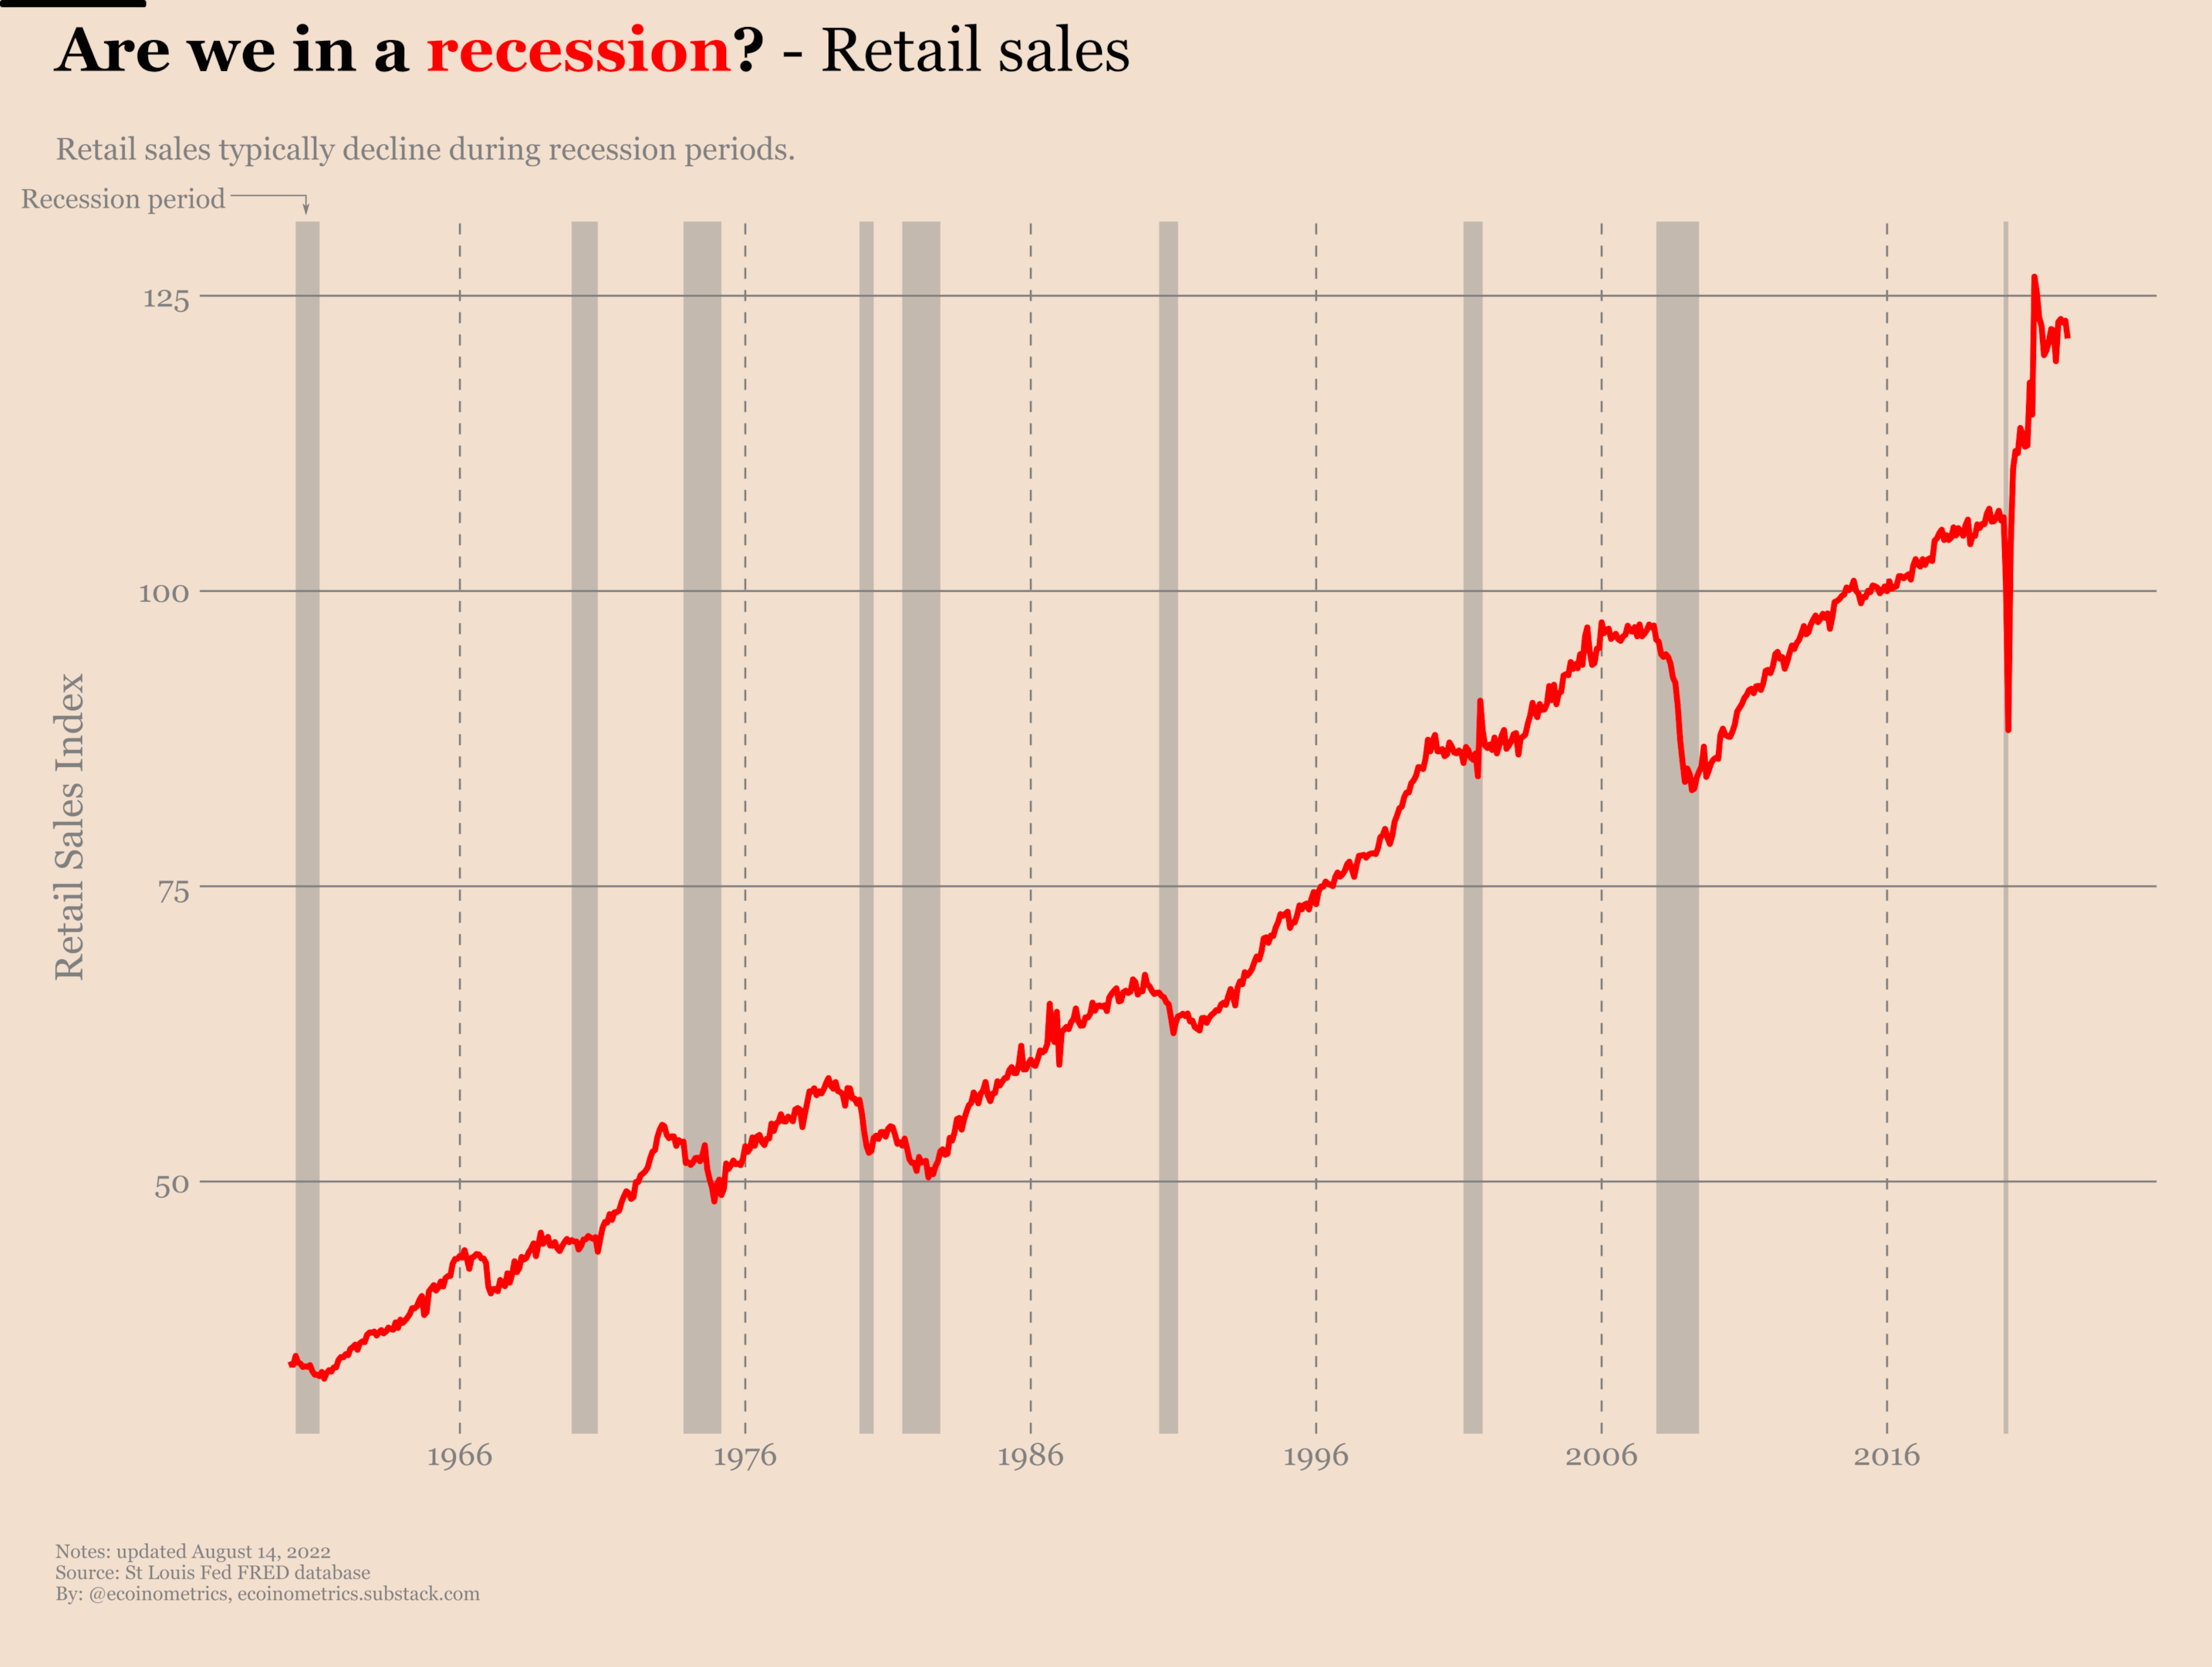
The retail sales counts all the sales from retail, e-commerce and food services in a given month. This metric is represented by an index whose reference is set at 100 in 2015. It is a measure of consumer spending.
On the vertical axis you can read the retail sales index. The official recession periods are represented by the grey bands. As you can see retail sales suffer during recession periods.
Looking at the trajectories of the retail sales during the previous recessions the trend typically is down or flat during those periods. Currently the retail sales index is pretty much flat. That’s compatible with a recession albeit not a a very sever one.
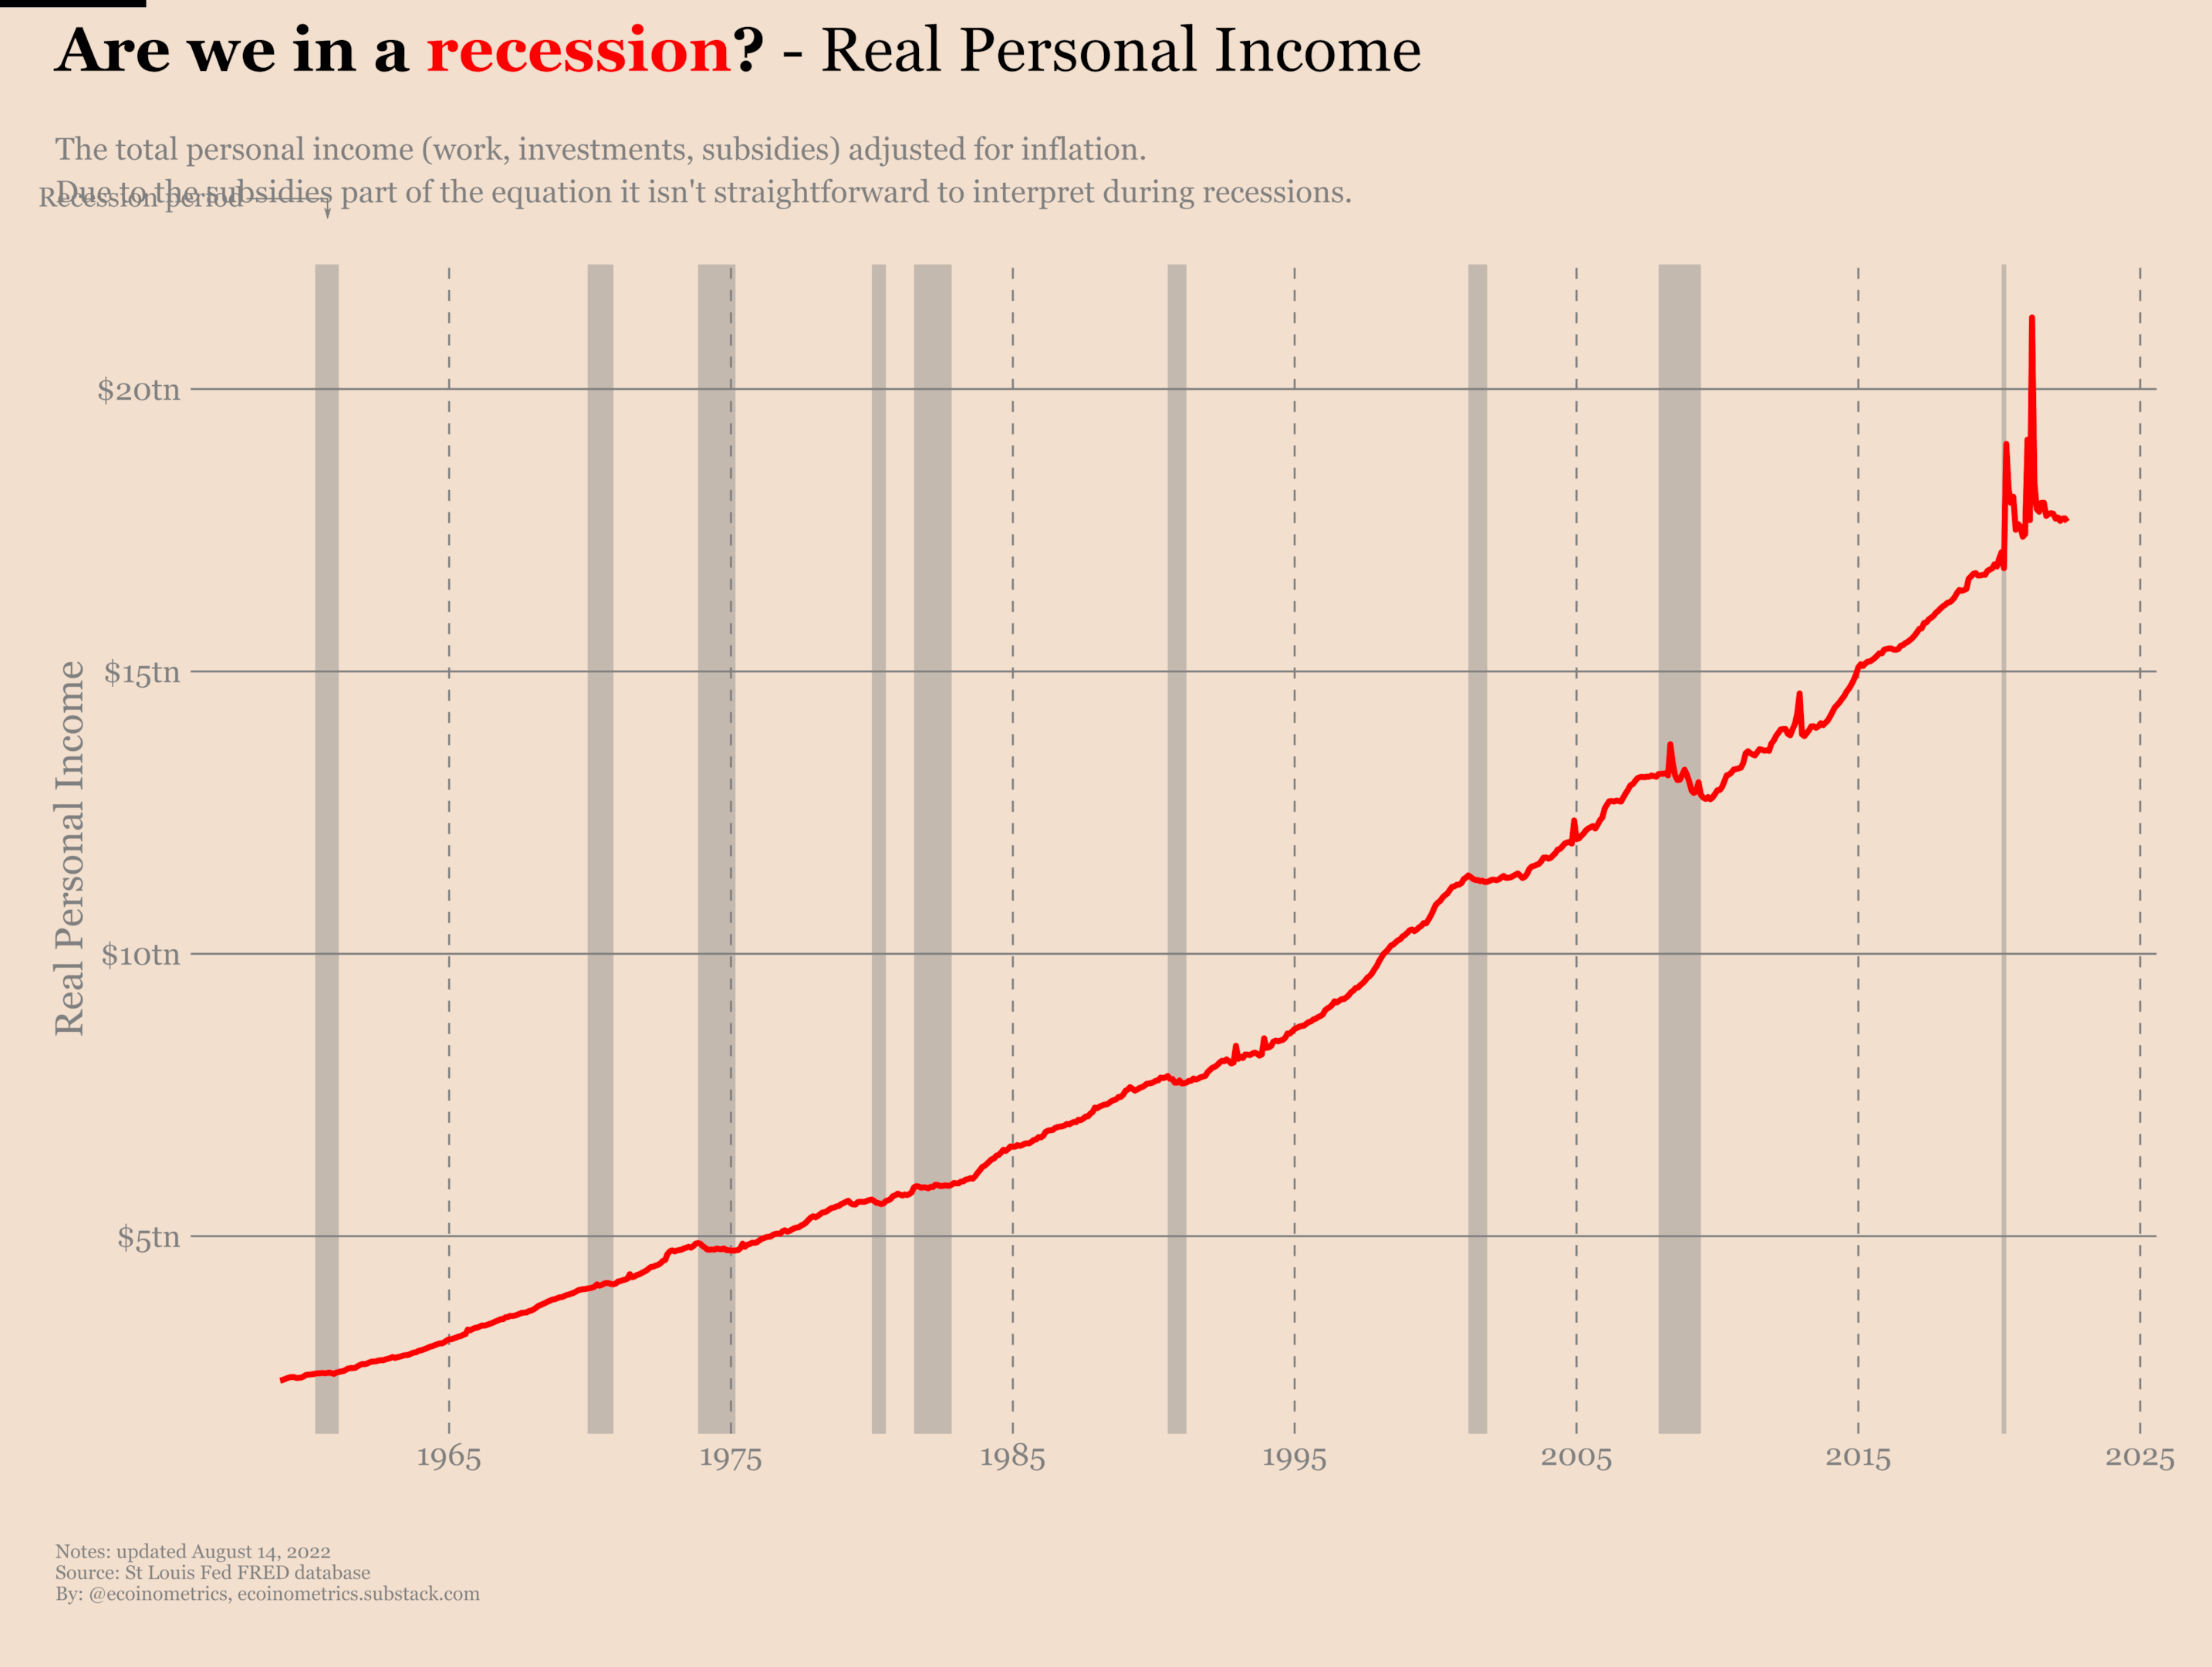
Real income during a recession
The real income also known as real personal income is the total income of individuals adjusted for inflation. The total income includes salaries, investments, subsidies, basically everything that goes in US individuals pockets.
This is a metric that you need to take care in interpreting. On many occasions the government has used subsidies to soften the blow of recessions. That means it is possible to see the real income spike in the middle of a recession without people actually earning more from their salary and investments.
On the vertical axis you can read the retail sales index. The official recession periods are represented by the grey bands. Particularly since the Great Recession of 2008 you can see that government subsidies are introducing spikes in real income even though the economy is in trouble.
But even without those government subsidies it is hard to find a clear pattern linking the real personal income and the recessions. Take a look at the trajectories of the real income during the previous recessions. It can go up. It can go down. It can do both… that’s very different than the clear pattern that the other recession metrics are showing.
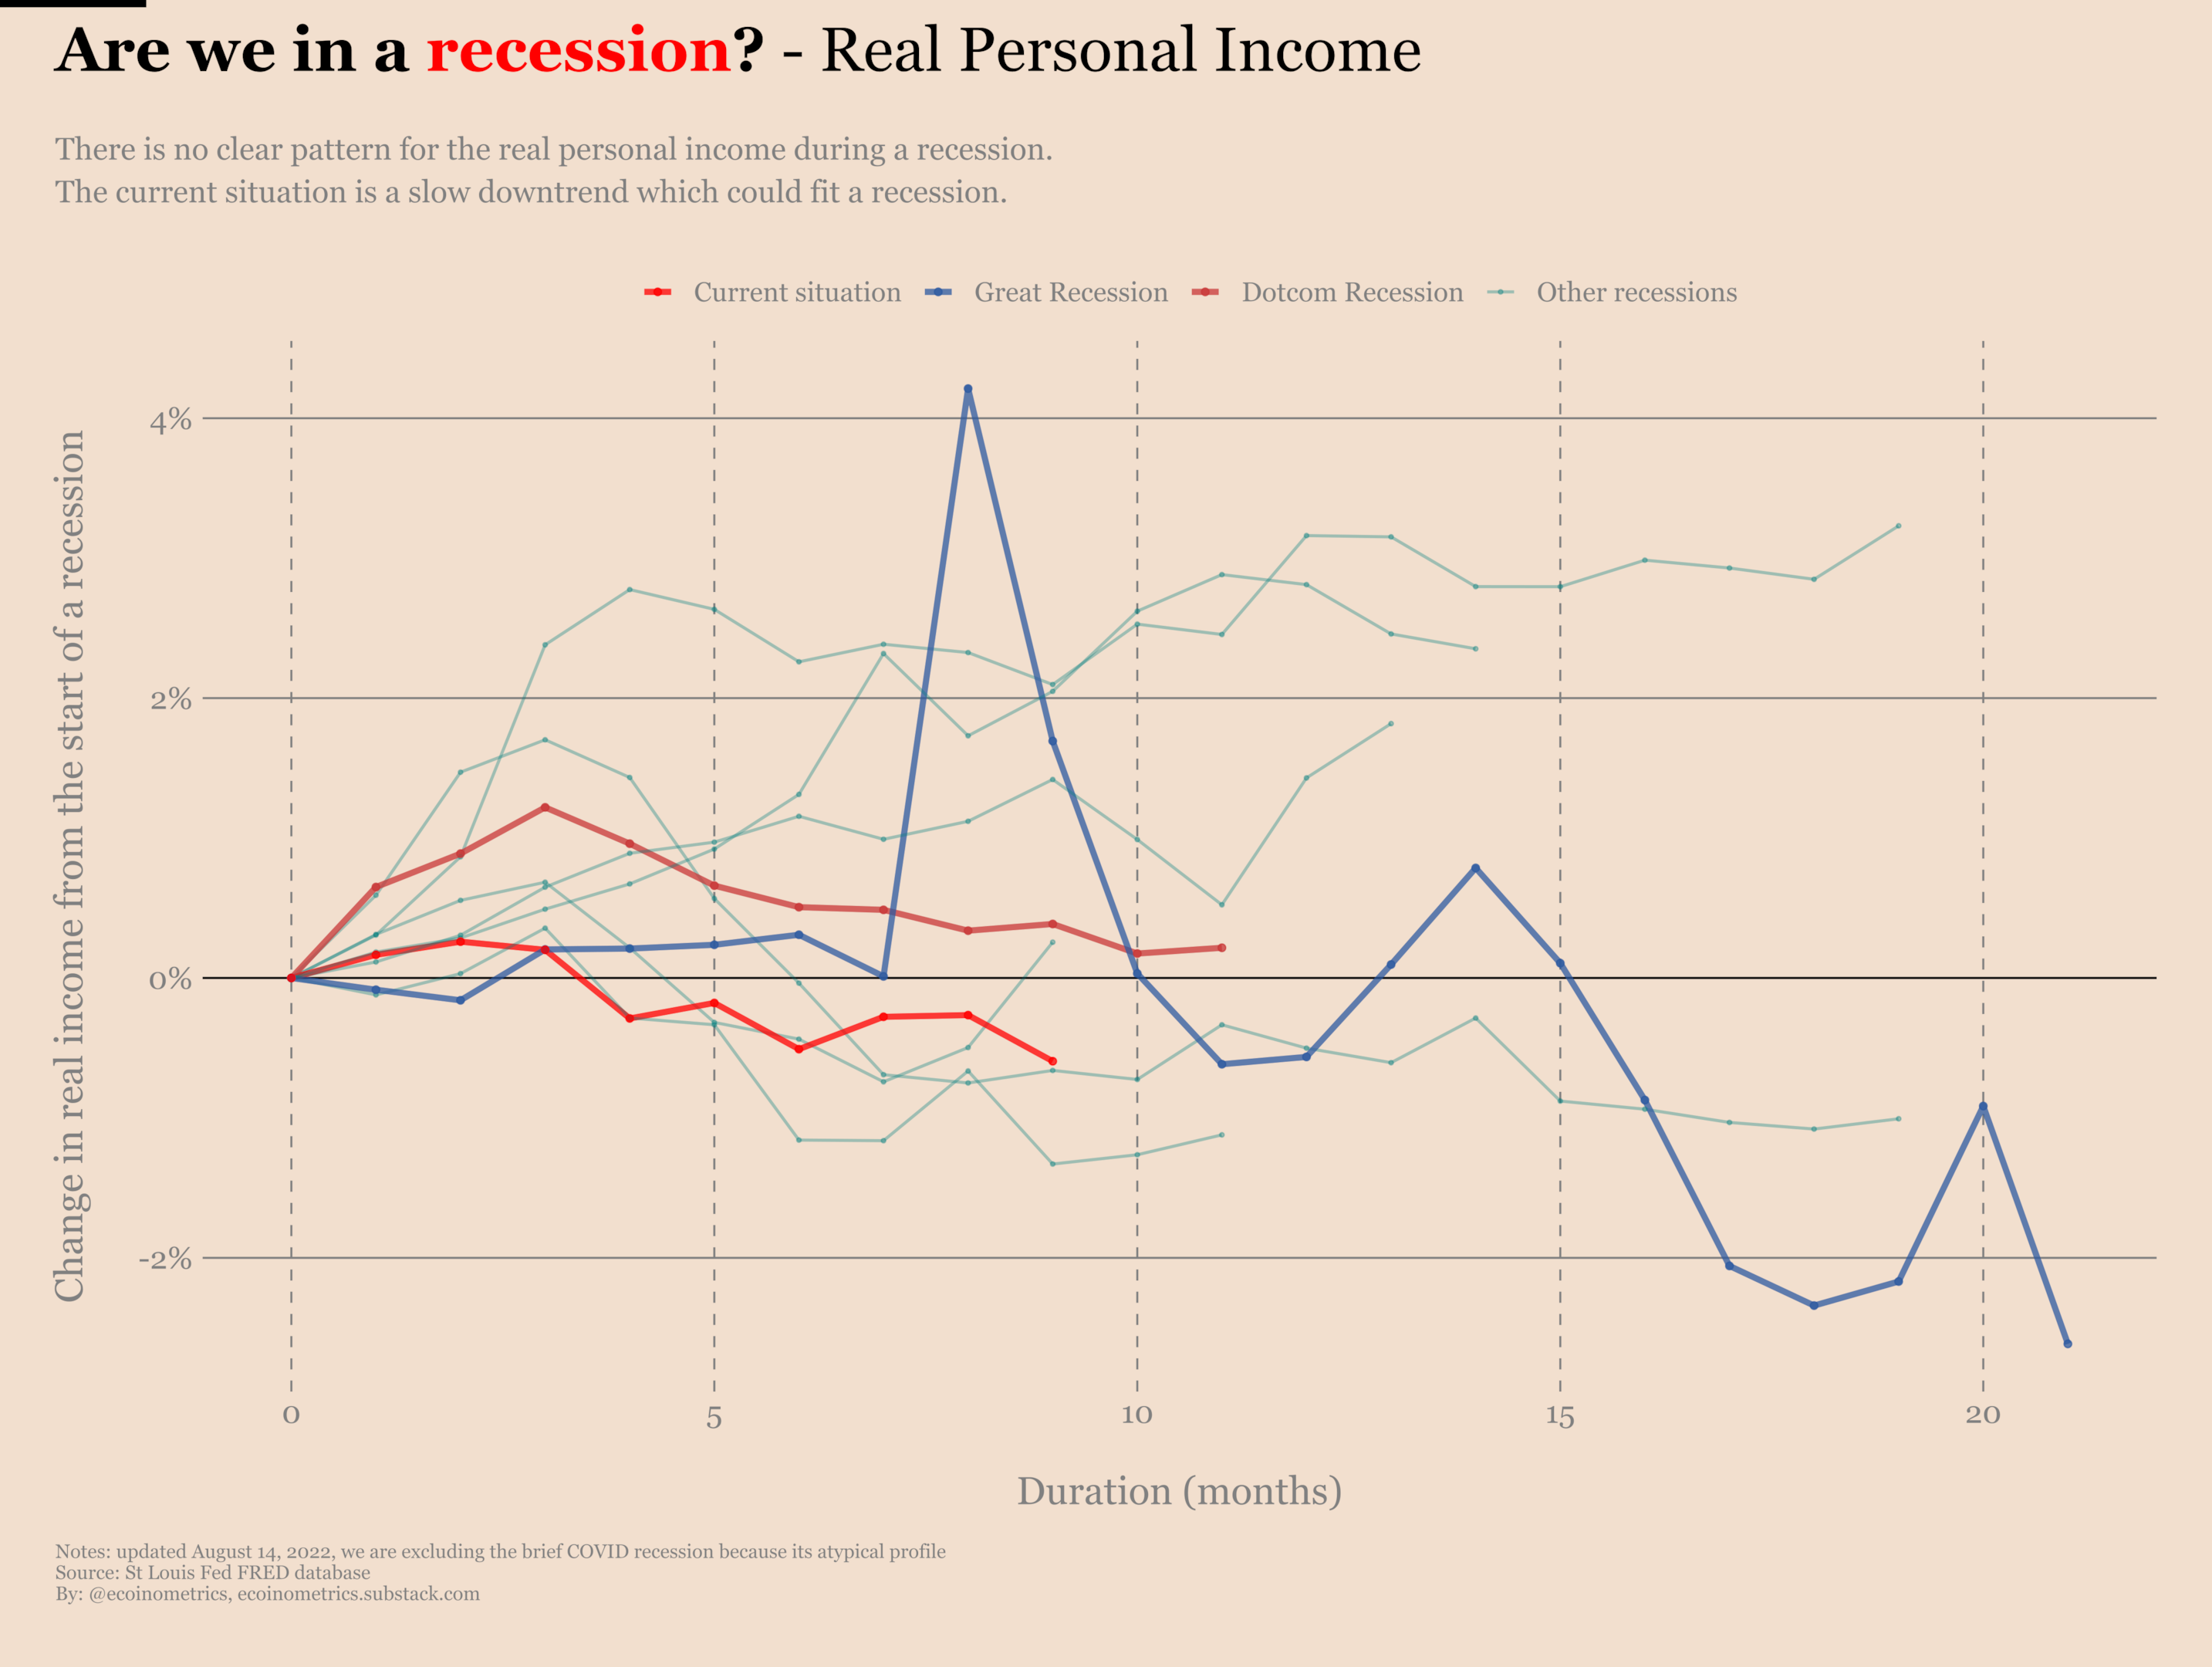
According to this metric it is very hard to conclude anything.
Is the US technically in a recession?
So are we in a recession or not? Here is the score card for the official definition of a recession:
- Real GDP, two consecutive quarters of decline, says we are in a recession.
- Unemployment, no sharp rise and tight job market, says we are not in a recession.
- Industrial production, trending up, says we are not in a recession.
- Retail sales, flattening, says we are in a recession.
- Real income, trending down, says we are in a recession.
That means three out of the five recession metrics indicate we are potentially in a recession.
When you look at it closer though, the metrics that most consistently indicate a recession are a decline in the real GDP together with a decline in the industrial output and a sharp rise in unemployment. On those three only the real GDP has turned negative. And that’s why it is so hard to call a recession at the moment.
So we’ll need to wait for the economists at the National Bureau of Economic Research to give their take.
Let’s point out an interesting pattern though.
Below you can see a chart of the quarterly changes in real GDP over the last 80 years. The negative quarters are in red. The official recession periods are represented by the grey bands.
Now take a look.
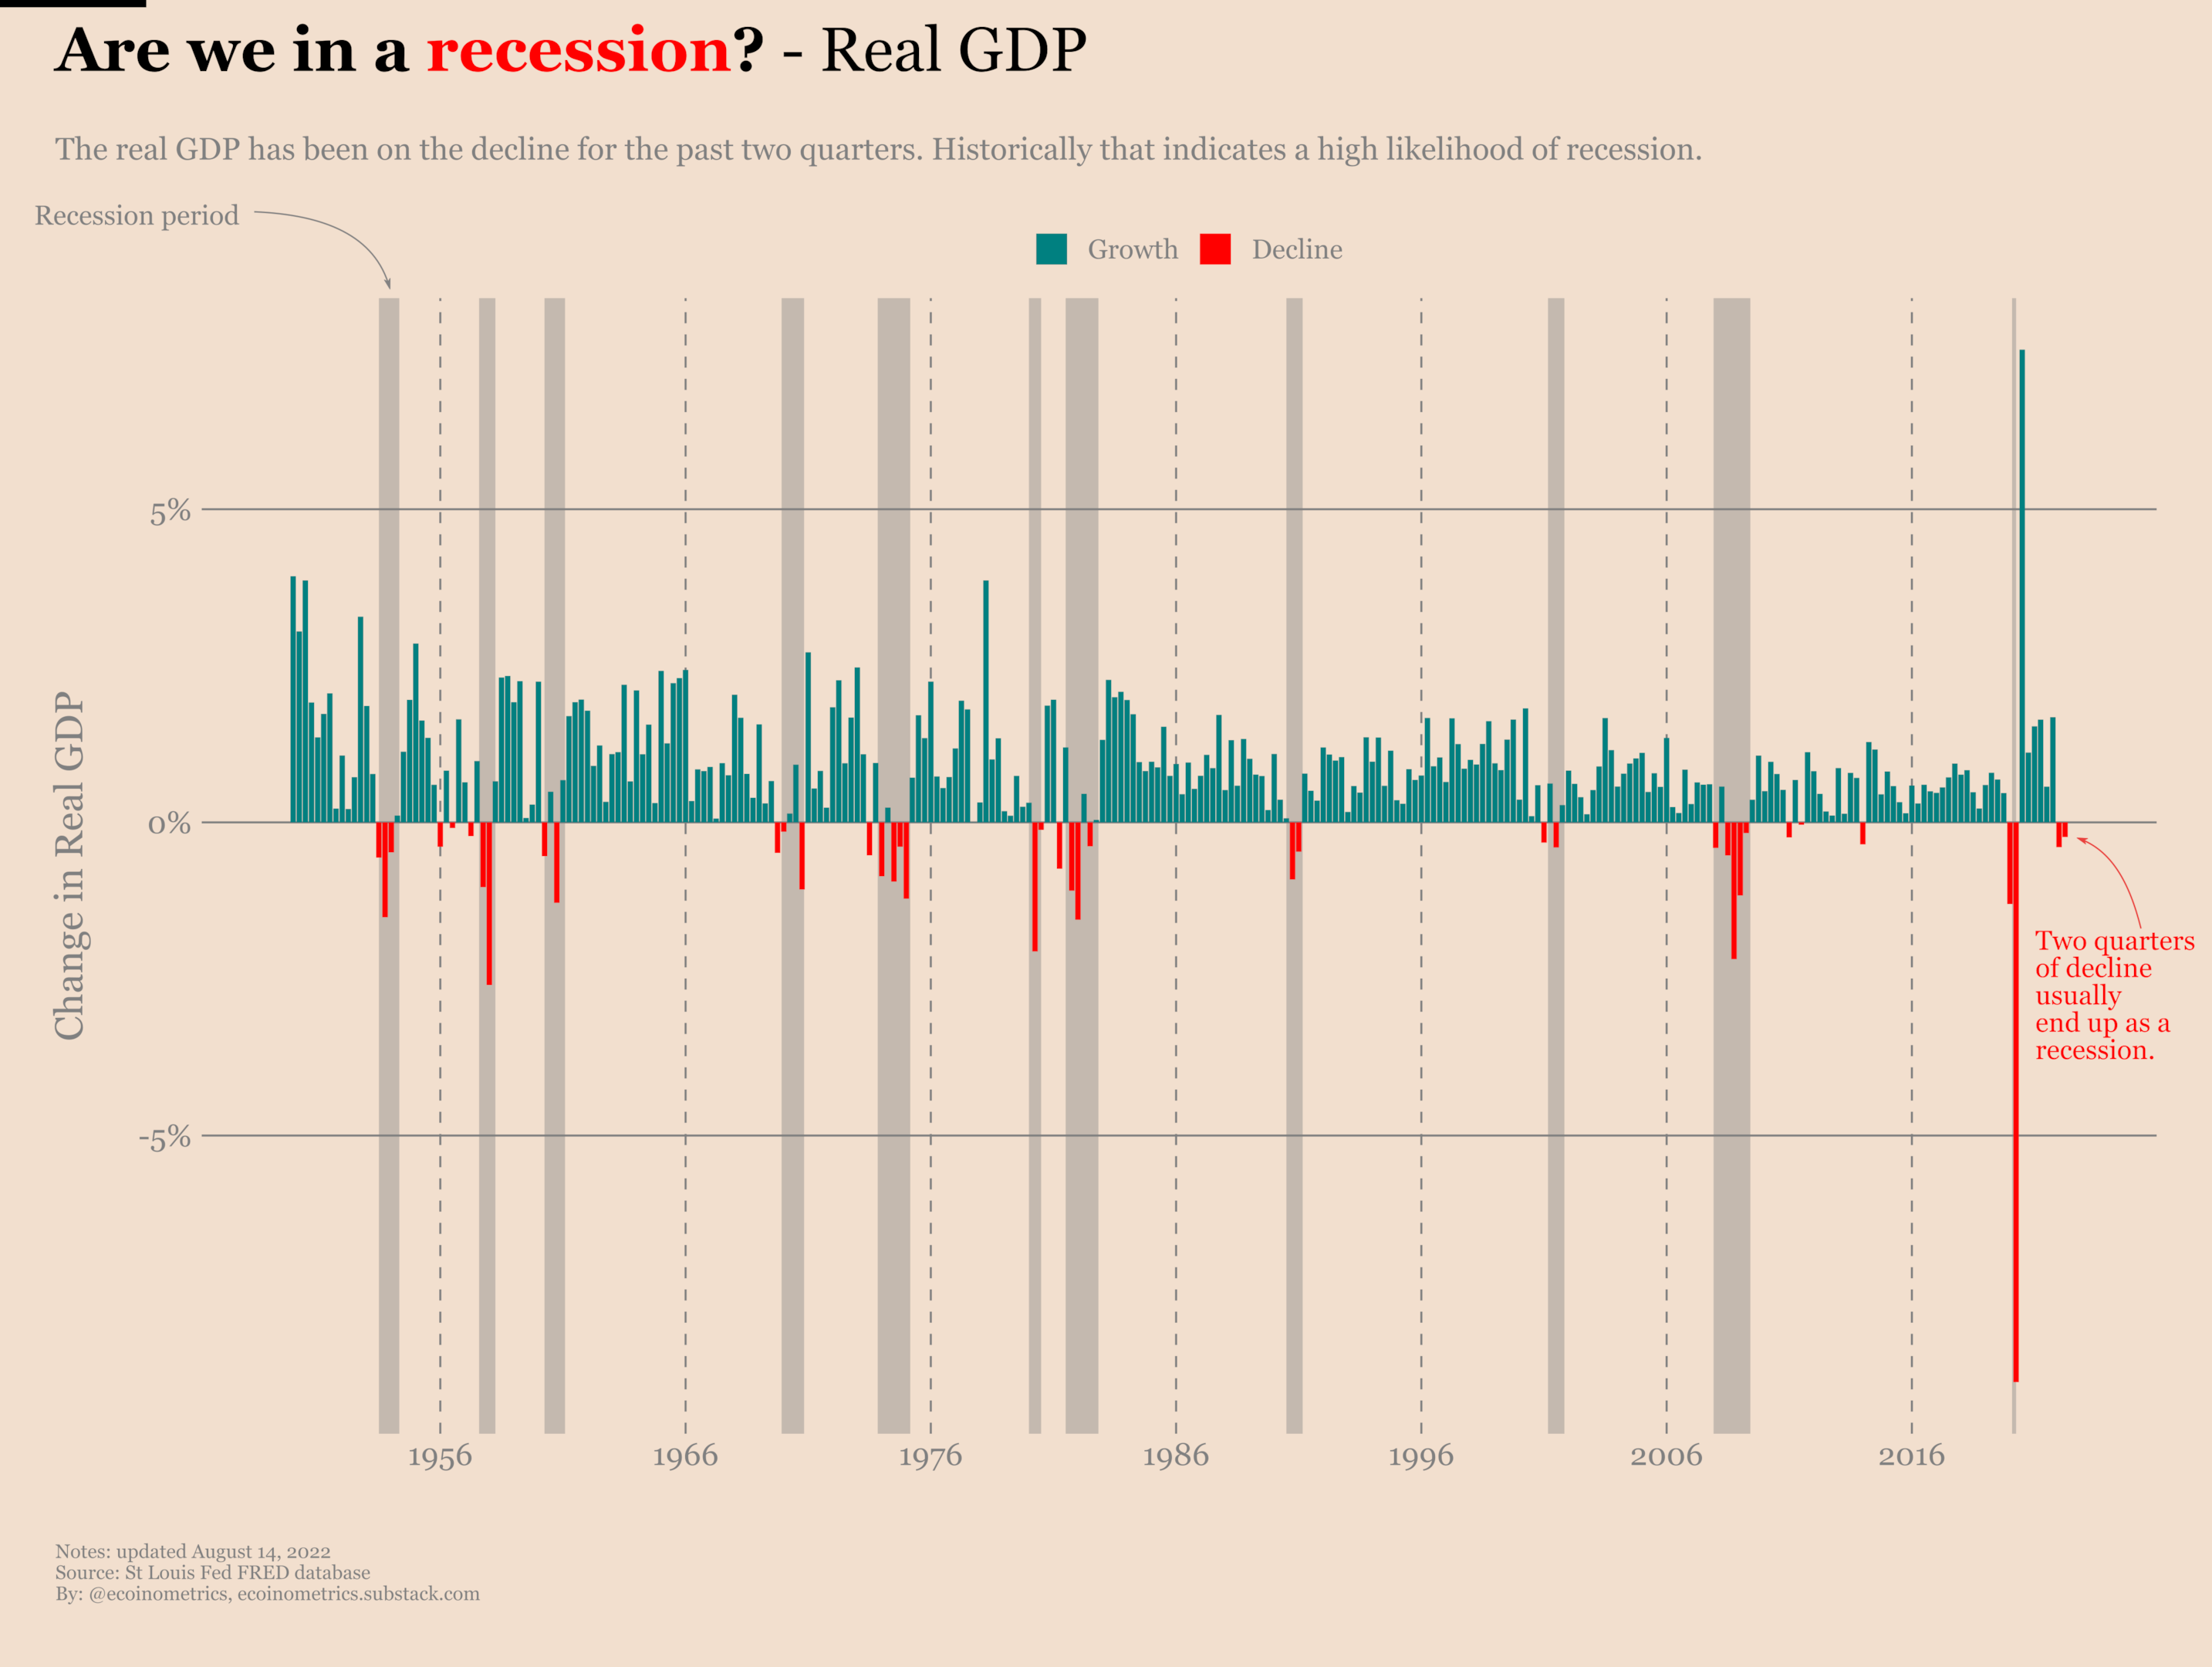
Over the past 80 years every single time the US had two consecutive quarters of negative real GDP the period was later declared to be a recession.
So the question is: is it going to be different this time?
Subscribe to the Ecoinometrics newsletter if you want help to navigate the landscape of digital assets and macroeconomics with investment strategies backed by data.